

Radar charts, also called spider or web charts, turn up in a lot of business presentations: vendor comparisons, product scorecards, skills assessments, maturity models. They look rich and technical, and they fit several criteria into one tidy shape.
The trouble is what happens when someone tries to read one. Ask a room which vendor scores highest on security, and by how much, and watch people trace lines from the centre outwards, compare colors with the legend, and guess. The chart looks impressive. It just doesn’t answer questions quickly.
This guide is for anyone who presents comparisons: product managers, consultants, procurement and sales teams, founders comparing themselves with competitors. It explains why radar charts are hard to read, how to choose a better format for the comparison you’re making, and how to build each one in PowerPoint and Google Slides.
Why radar charts are hard to read
A radar chart places each criterion on its own axis, all starting at the centre and pointing outwards like spokes. Each option’s scores are joined into a shape. Readers then compare the shapes. That creates four problems.

The shape depends on the order of the axes. The same six scores make a different shape depending on which criteria sit next to each other. Put two high scores side by side and you get a big bulge. Separate them and the shape looks spikier and smaller. Readers react to the shape, so an arbitrary choice, the axis order, changes the message.
Area grows faster than the scores. If every score doubles, the shape covers four times the area. People tend to judge the size of a shape by its area, so differences look bigger than they are.
Low scores get crowded. Near the centre, the spokes are close together, so points on neighbouring axes bunch up. Small differences between low scores become hard to see.
Shapes hide each other. With two options you can just about follow both outlines. With three or more, the middle shape is partly covered, and readers spend their time matching colors to the legend.
On top of that, there’s no shared baseline. On a bar chart, every bar starts from the same line and you compare lengths. On a radar chart, every axis points in a different direction, so comparing a score on one axis with a score on another is guesswork.
Start with the question: what should the reader compare?
Before choosing a chart, decide what the slide is for. Most radar charts are trying to do one of four jobs, and each has a clearer format:
- One option across several criteria (a product’s strengths and weaknesses): sorted horizontal bars.
- Two options, head to head (us vs the main competitor, this year vs last year): a dot plot.
- Three or more options across several criteria (a vendor shortlist): a table with the best score in each row highlighted.
- Scores changing over time (a maturity assessment repeated each year): a line chart, or a slope chart for two points in time.
Every one of these puts the values on a shared, straight scale. That’s what makes them fast to read.
Fix 1: One option? Use sorted bars
When the slide is about one option’s profile, horizontal bars do everything the radar chart was trying to do, and more clearly.
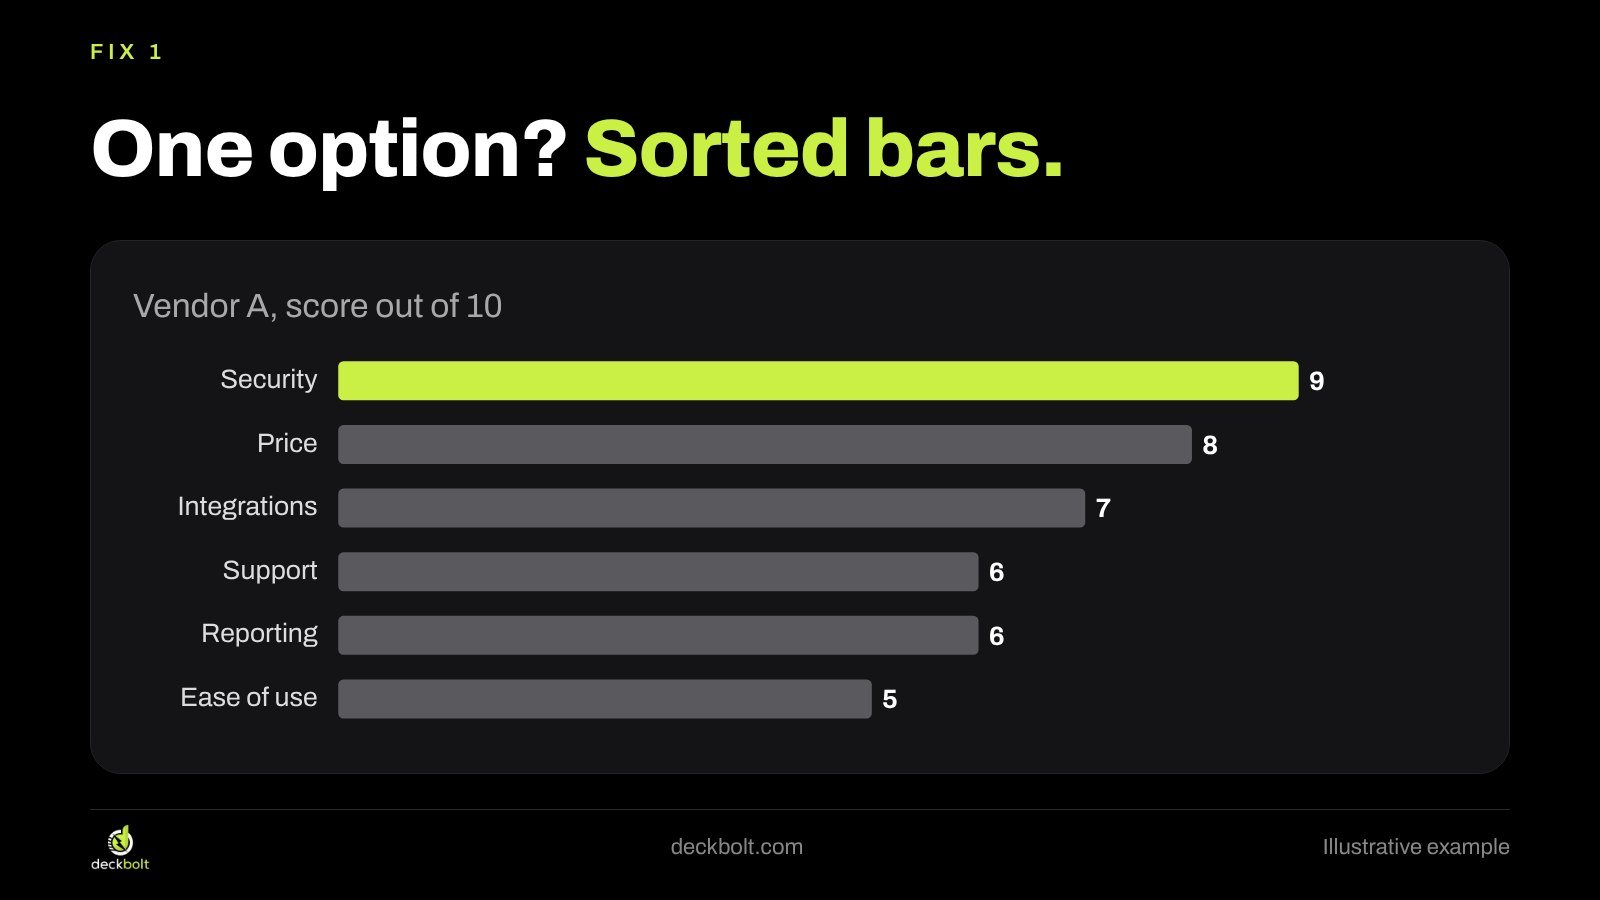
In the illustrative example, Vendor A scores 9 on security, 8 on price, 7 on integrations, 6 on support and reporting, and 5 on ease of use. As bars sorted from highest to lowest, the profile reads in one glance: strongest on security, weakest on ease of use. No legend, no tracing lines from the centre.
Three details help:
- Sort by score, not in the order of the original scorecard, unless that order means something.
- Label the bars with their values and drop the value axis.
- Use one accent color for the bar your title is about. Keep the rest gray.
Fix 2: Two options? Use a dot plot
When the point of the slide is how two options compare, a dot plot is often the clearest choice. Each criterion gets its own row. Each option gets a dot on that row, and a line connects the two dots.

The length of the line is the gap. A long line means a big difference; dots close together mean the two options are level on that criterion. Readers can see who wins each row and by how much without comparing overlapping outlines.
In the example, Vendor A leads on price, integrations and security, while Vendor B leads on support, ease of use and reporting. That pattern was in the radar chart too, but it took effort to find. In the dot plot it’s visible immediately.
Sort the rows if there’s a natural ranking, for example by the size of the gap or by how important each criterion is to the buyer. If you have the weights from a buying committee’s score sheet, ordering rows by weight makes the slide even more useful.
Fix 3: Three or more options? Let a table be the chart
With three or more options, any chart starts to get crowded. A simple table, with the best score in each row highlighted, often works better than any graphic.
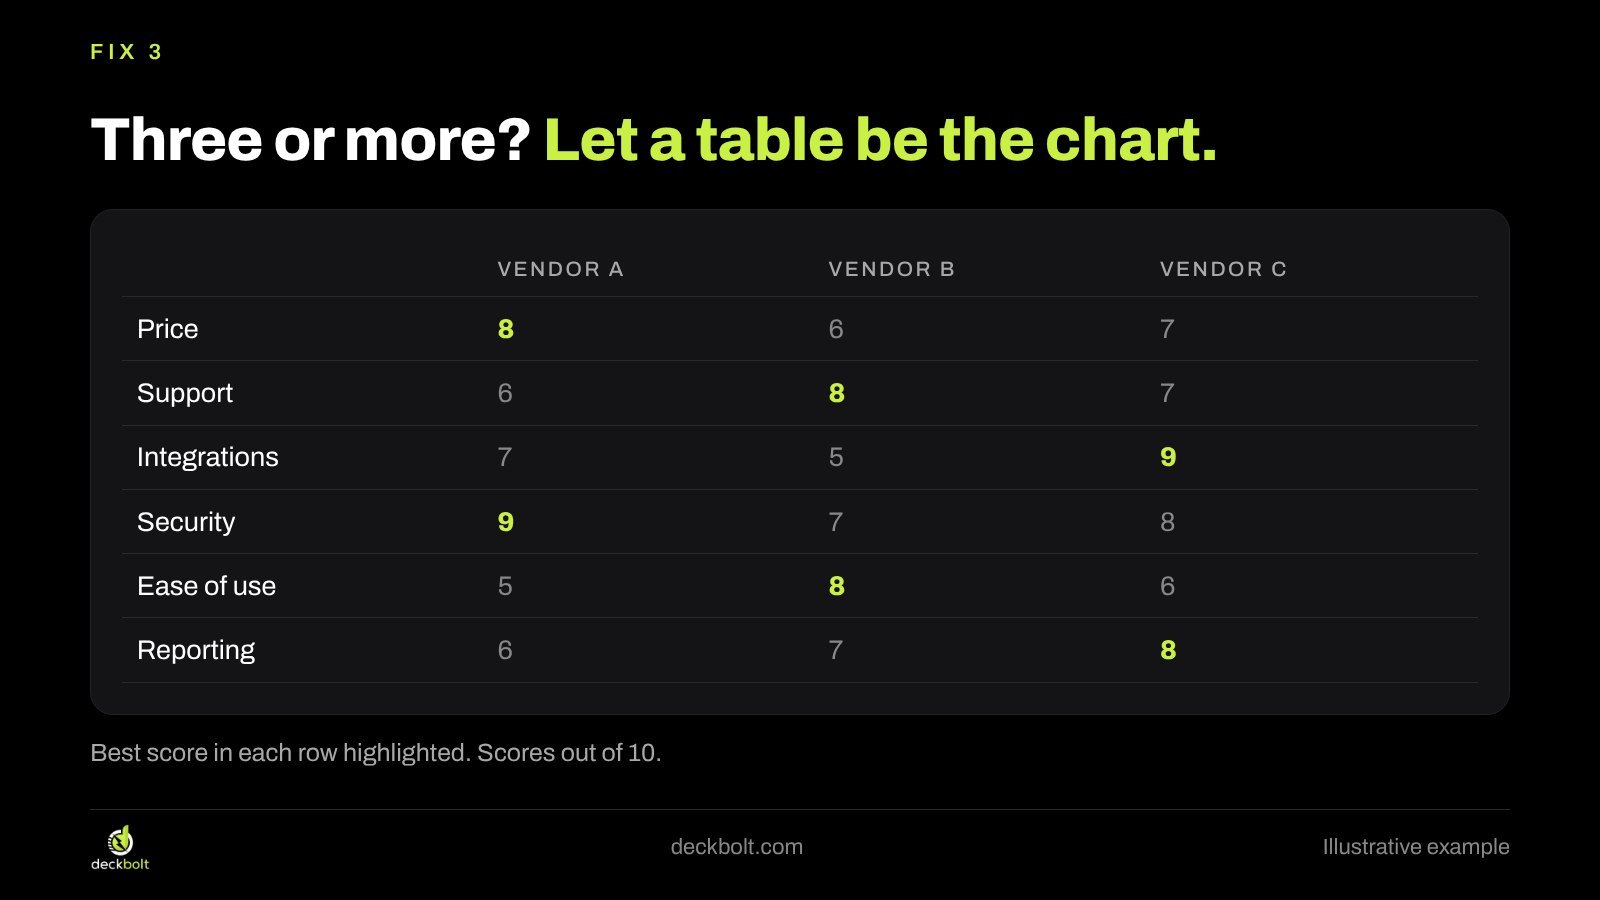
In the illustrative scores, the highlighted cells show the pattern straight away: Vendor A is best on price and security, Vendor B on support and ease of use, and Vendor C on integrations and reporting. The table also lets readers look up any individual score, which a radar chart never really allows.
If you need more emphasis, add a final row with a weighted total, or a short line under the table that explains how the scores were set. If a few criteria matter much more than the others, say so on the slide.
Before and after: put the answer in the title
The most common radar-chart slide has a title like “Vendor Comparison” or “Capability Assessment”. It names the data, not the finding. Whatever format you choose, the biggest improvement comes from writing the answer in the title.
In the example, “Vendor Comparison” becomes “Vendor C leads on integrations and reporting. A is strongest on security.” Under it, the table with highlighted best scores shows the evidence. A reader who only looks at the title still leaves with the main point, and a reader who studies the table can check it.
This matters most when the slide supports a decision. If the meeting has to pick a vendor, the slide should help them see the trade-off, not admire a shape.
When a radar chart can still work
Radar charts aren’t always wrong. They can work when the overall shape is the point and readers already know how to read it: a familiar profile that the audience sees every quarter, for instance, or a sports or skills profile where the “balanced vs spiky” pattern is what matters. Even then, a few rules help:
- Show one or two shapes at most.
- Keep the axis order fixed every time you use the chart, so the shapes stay comparable.
- Label the values at each point, so readers don’t have to estimate.
- Write the takeaway in the title.
Common mistakes with comparison slides
- Showing every option in one chart because the data is available, rather than focusing on the ones being decided between.
- Using a legend when direct labels would do. Every trip to the legend slows the reader down.
- Different scales on different criteria without saying so. If one criterion is out of 5 and another out of 10, convert them first.
- Precise-looking scores from rough judgments. If scores came from a quick workshop, say so on the slide.
- A chart with no point. If you can’t write a title that states the finding, the comparison may not be ready for a slide yet.
Building these charts in PowerPoint and Google Slides
Sorted bars. In PowerPoint, select the chart and go to Chart Design → Change Chart Type → Bar. Sort the data in the chart’s worksheet. If the order comes out upside down, right-click the category axis, choose Format Axis and tick Categories in reverse order. In Google Slides, build the chart in Google Sheets (in the Chart editor, choose Bar chart), then use Insert → Chart → From Sheets so it stays linked to the data.
Dot plots. Neither tool has a one-click dot plot. In Google Sheets, a scatter chart with criteria as numbered rows gets close. In PowerPoint, many designers simply draw the dots and lines with shapes on a light grid, which also gives full control over labels. Keep the scale fixed and evenly spaced if you draw it by hand.
Tables. Use Insert → Table in either tool. Right-align numbers, keep the borders light, and fill only the best cell in each row with your accent color.
Checklist: five questions before you use a radar chart
- Can readers find one value without guessing?
- Would reordering the axes change the story?
- Are any shapes hidden behind others?
- Does the title say who wins, and where?
- Would bars, dots or a table answer the question faster?
If you answer “yes” to the last question, switch formats. Your audience will reach the point faster.
For more on choosing charts, see why the right chart starts with the question, how to make tables where the answer is easy to find, and how to present when you’re on a vendor shortlist.
All scores and vendor names in this article are illustrative examples.
Want charts in your next deck that make one clear point? DeckBolt designs pitch decks and business presentations where every chart reads at a glance. Request a free deck review.