

Many grant presentations open the same way. A slide with the program name. Then a list of what the team will do: twelve workshops, four open days, three hundred hours of mentoring, a graduation event. Then the budget. Then a thank-you slide.
Every item on that list may be true and well planned. But the person reading it, the program officer or the panel member who has to recommend your proposal to their board, is looking for something else. They want to know what will be different once the money is spent, and for whom. Activities are how you get there. They are not what the funder is buying.
This guide is for nonprofit leaders, social enterprise founders, research teams and anyone who presents to a foundation, a public funder or a corporate giving program. It walks through five moves that turn an activity list into a presentation built around the change you will make, with a worked example, a before/after running order and a short checklist.
Note: the youth employment program, numbers and budget used throughout this article are illustrative. They show the method; they are not data from a real program.
Why grant decks drift toward activities
It is easy to see how it happens. Activities are what your team plans, staffs and runs every week. They are concrete, they are already in your project plan, and they are easy to count. Outcomes are harder. They happen later, to other people, and they depend on things you don’t fully control.
So the deck ends up describing the work rather than the result. A typical sign is a title like “Youth Skills Program 2027”: a name, not a claim. Another is a budget slide that lists costs by line item with no link to what those costs produce.
The funder then has to do the translation themselves. They read your activities and try to guess what change they add up to. Some will guess generously. Many will simply move on to a proposal that did the translation for them.
The chain: activities, outputs, outcomes
A useful way to plan the presentation is to separate three layers that often get mixed together:
- Activities are what you do. Twelve job-skills workshops.
- Outputs are what you deliver, the direct and countable result of the activities. 180 young people finish the course.
- Outcomes are what changes for people as a result. 90 of them are in paid work within six months.

Funders decide on the last layer. Outputs matter as evidence that the work happened, but a course completed is not the same as a job found. Many funders describe this chain as a logic model or a theory of change, and some ask for one in a set format. Even when they don’t, thinking in these three layers keeps the presentation honest about what you are promising.
When you plan, read the chain from right to left. Start from the change you want, then ask what it takes to get there. When you present, lead with the right-hand side too. The rest of the deck explains how you will make it happen.
Move 1: Lead with the outcome
The first line a funder reads should say who changes, by how much and by when. Compare these two titles:
- Before: “Youth Skills Program 2027”
- After: “We’ll help 90 young people in Eastside get into paid work within a year.”
The second one is longer, but it does the funder’s job for them. It names the group, the change, the size of the change and the timeframe. Everything after it now has a frame: the reader knows what each slide is trying to support.
A simple fill-in-the-blanks line helps:
We’ll help [how many] [who] [what changes] by [when].
If you can’t fill in the blanks, that is useful information too. It often means the program is still defined by its activities, and the outcome needs a conversation inside your team before it goes in front of a funder.
Keep the outcome specific but realistic. A funder would rather read a smaller number you can defend than a large one that collapses at the first question.
Move 2: Show the chain, activity by activity
Once the outcome is on the first slide, every activity should point at it. A simple two-column slide does this well: the activity on the left, and on the right, one line on how it leads to the outcome.
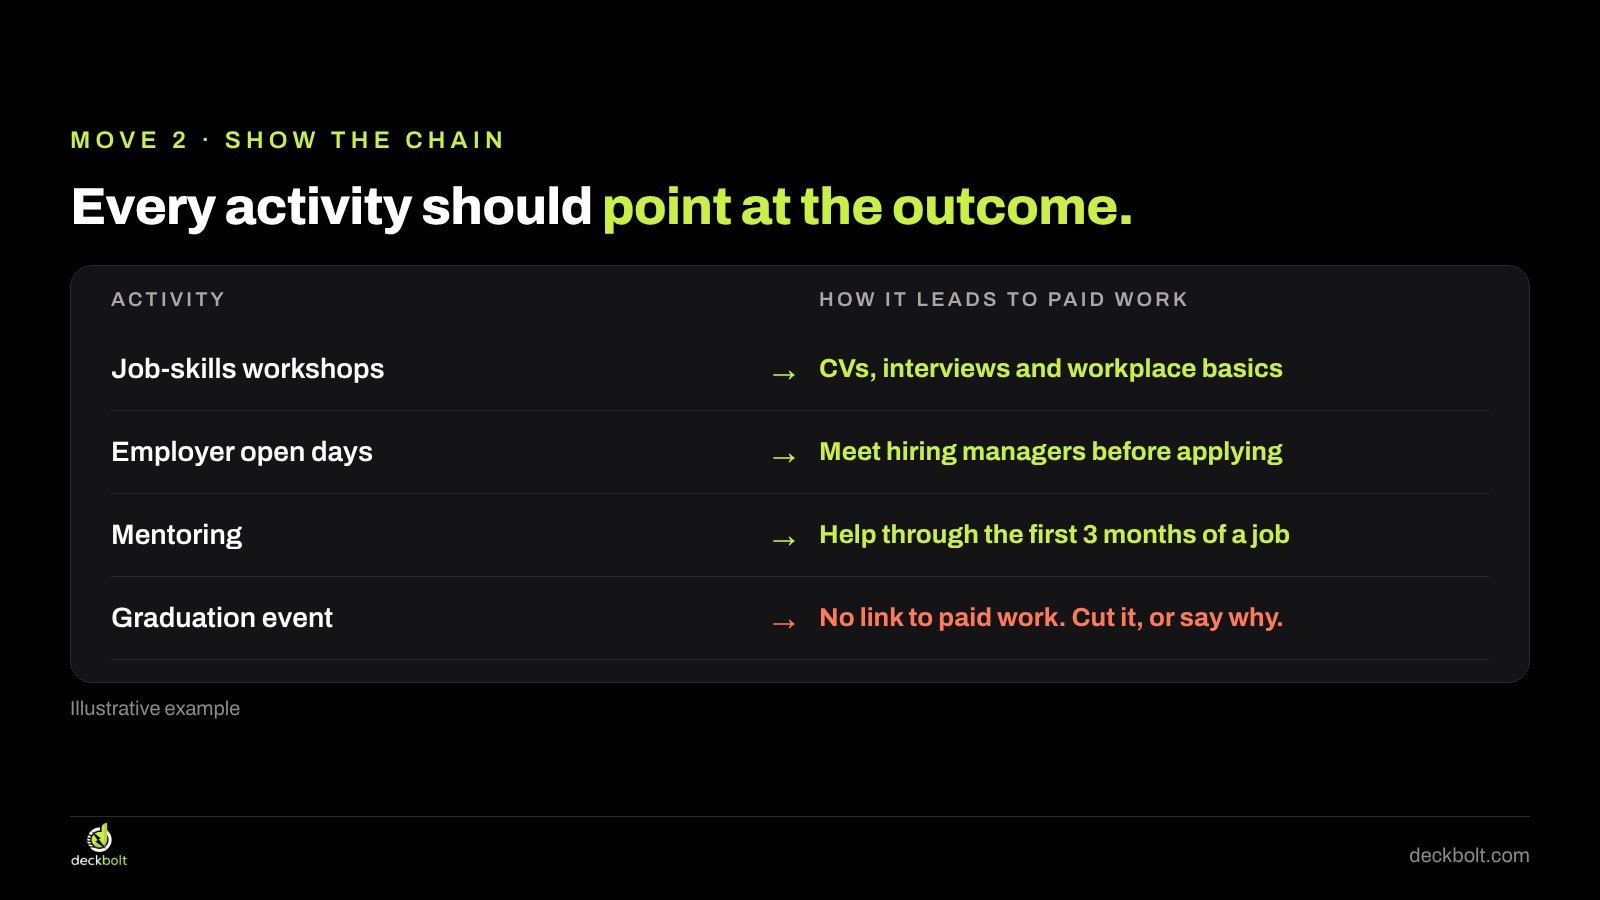
In the example:
- Job-skills workshops lead to CVs, interview practice and workplace basics.
- Employer open days let young people meet hiring managers before they apply.
- Mentoring helps them through the first three months in a job, when many people drop out.
- The graduation event has no clear link to paid work.
That last line is the point of the exercise. If you can’t draw the arrow, the funder will ask why the activity is in the budget. You have two good options: cut it, or say why it matters in a sentence (for example, if a graduation event is where employers meet the group, say so). What you want to avoid is a list where some items quietly do no work.
This slide also protects you in the question round. When a panel member asks “why mentoring?”, the answer is already on the screen.
Move 3: Measure what you will actually track
Funders want to know how you’ll know it worked. The common mistake is to promise too much: ten indicators, several of which nobody on the team will have time to collect. Three measures you’ll check beat ten you won’t.
For each measure, show four things in a small table:
- The measure, in plain words.
- Today: the starting point, often called the baseline. Where the group starts without the program.
- The target: what you expect by the end.
- How you’ll check: attendance records, follow-up calls, an employer check.

In the example, the course aims for 180 of 220 starters to finish. The key outcome is 90 of those 180 in paid work at six months, which is 1 in 2, compared with a starting point of about 1 in 5 for the group today. A third measure follows up at twelve months: 70 of the 90 still in work.
The baseline does a lot of work here. Without it, “90 in paid work” could be impressive or ordinary. With it, the funder can see the size of the change you’re claiming. If you don’t have a reliable baseline, say how you’ll establish one in the first months of the grant rather than inventing a figure.
Be careful with the word “because”. If some of those young people would have found work anyway, a careful funder will know it. You don’t need a research study to present well, but you should claim the change you can show, and describe how you’ll learn more.
Move 4: Tie the budget to the outcome
A budget slide usually lists costs. Trainers, mentoring, job placement, evaluation. That is necessary, and many funders will ask for a detailed budget in their own template anyway. But on the presentation slide, show what the money buys.
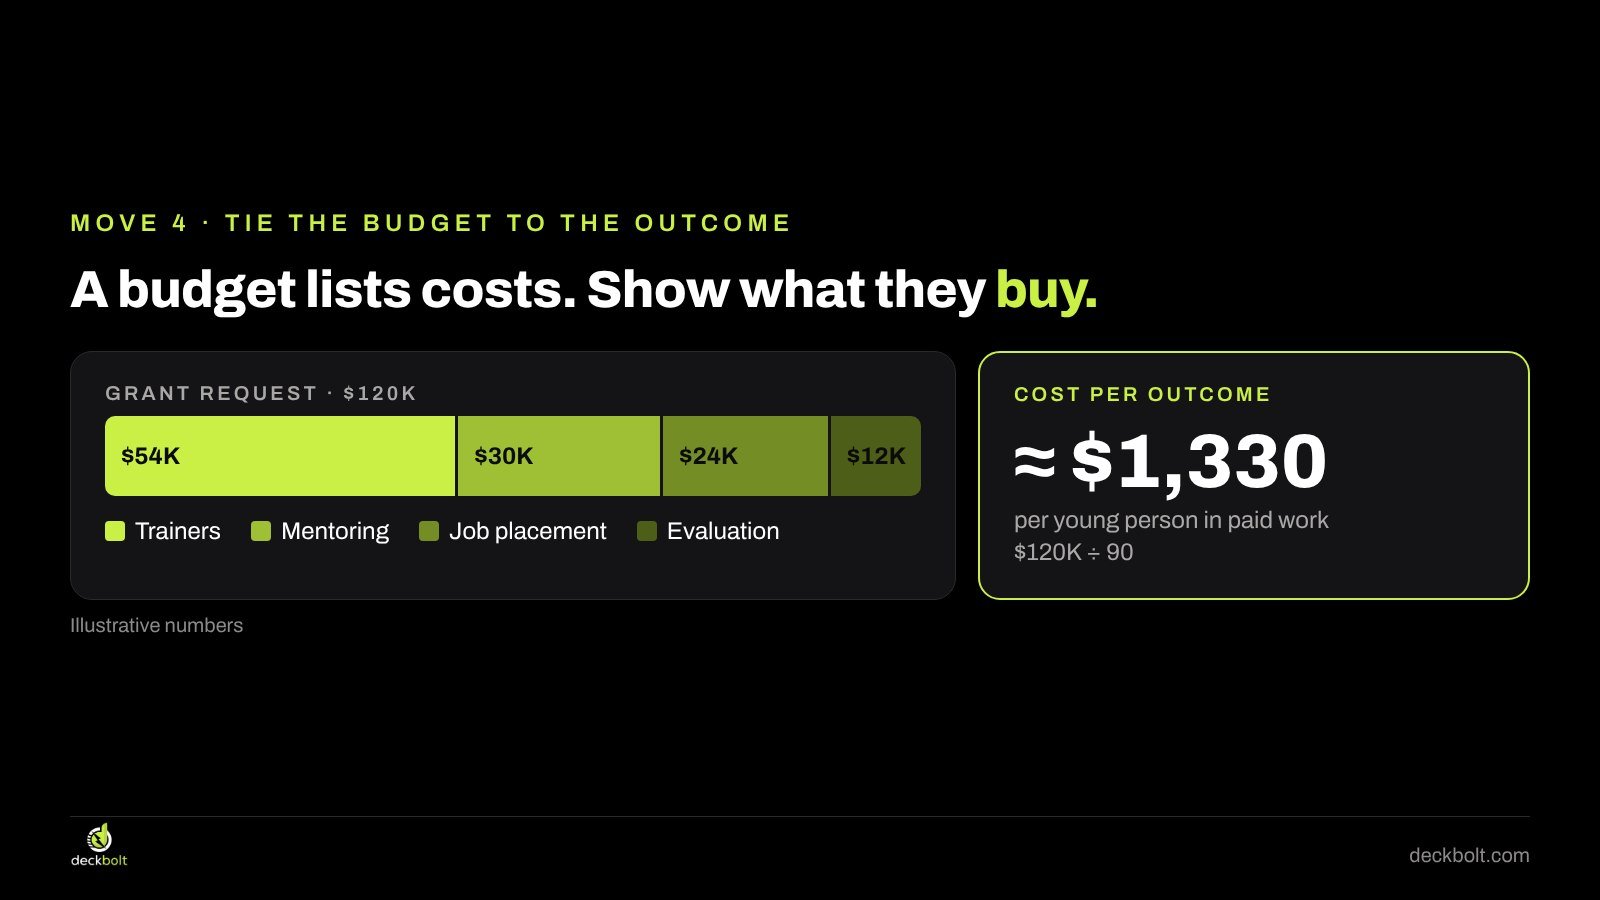
In the example, the grant request is $120K: $54K for trainers, $30K for mentoring, $24K for job placement and $12K for evaluation. Divide the total by the outcome and you get a figure funders understand quickly: about $1,330 per young person in paid work ($120K ÷ 90).
A cost per outcome helps in two ways. The funder can compare it with what the problem costs today, and with other ways of getting the same result. And it shows that you’ve thought about value, not just spending. Present it plainly, with the calculation visible, so nobody has to rebuild it.
Two cautions. First, don’t compare your cost per outcome with other organisations’ figures unless you have a source you can cite. Second, if part of the outcome depends on money from elsewhere, say so. A cost per outcome that quietly ignores co-funding will not survive a careful reader.
If you’re presenting a budget inside your own organisation rather than to an external funder, the same logic applies. Our guide to budget request presentations covers that version.
Move 5: Say what happens after the grant
Funders regularly ask what happens when their money stops. Answer it before they do, with the line that is true for you:
- It continues. Say who pays from year two: partner fees, other funders, a public contract you’re applying for.
- It hands over. Say who takes it on: a school, a council team, an employer group.
- It ends, on purpose. Say what stays: the people in work, a tested method, the data you collected.
- It grows. Say what the next stage needs and what this grant has to prove first.
“We don’t know yet” is also an answer, as long as it comes with a date and a plan to find out. What hurts a proposal is silence on the question, which leaves the funder to assume the worst.
Before and after: the running order
Most of these moves change the order of the presentation as much as its content. Here is the same program, presented two ways.

Before (about us first): About us, Our history, Our programs, Activities, Budget, Team, Thank you.
After (the change first): The change we’ll make, Where people start, How we get there, How we’ll measure it, Budget and cost per outcome, After the grant, Who we are.
The facts are the same. In the second deck, the funder knows the result before the detail, so every slide after the first one reads as evidence. Your organisation’s history still has a place; it just moves to the end, where it answers “why should we trust this team to deliver?” rather than delaying the point.
The same principle runs through most decision-making decks. Our guides to the executive summary slide and to bank loan presentations apply it to other audiences: lead with what the reader is deciding on, then support it.
Common mistakes to avoid
- Counting outputs as outcomes. “180 people trained” is an output. Say what changed for them.
- Too many measures. If a measure has no owner and no method, drop it.
- No baseline. A target without a starting point can’t show change.
- Borrowed statistics. A dramatic national figure on the problem slide is fine if it is sourced and relevant to your group. If it isn’t, it weakens everything after it.
- A budget with no link to results. Show the total, the main lines and the cost per outcome.
- Ignoring the funder’s own priorities. Read their published criteria and use their words where they fit. If they ask for a theory of change in a set format, follow it.
Building it in PowerPoint or Google Slides
None of this needs special software. The chain slide is three rounded rectangles with arrows between them; keep the outcome box in your accent color and the other two neutral. The activity-to-outcome slide works best as a simple two-column table with plenty of row spacing. For the budget, a single stacked bar showing the split of the total is often clearer than a pie chart, with the cost per outcome in large type next to it.
Set your accent color once in the theme (in PowerPoint, Design → Variants → Colors; in Google Slides, Slide → Edit theme) so the outcome is highlighted the same way on every slide. Consistency here helps the funder see, at a glance, which element on each slide is the result.
A five-question checklist before you send it
- Does the first line say who changes, how much and by when?
- Can you draw an arrow from every activity to the outcome?
- Does each measure have a starting point and a target?
- Can the funder see the cost per outcome?
- Do you say what happens after the grant?
Then try the hallway test: could the program officer explain your proposal to their board in one sentence? If that sentence would be your first line, the presentation is doing its job.
Need a second pair of eyes?
DeckBolt designs grant, investor and lender presentations that lead with the result, in PowerPoint and Google Slides. If you have a proposal deck in progress, request a free deck review and we’ll tell you the three slides we’d fix first.