

Rankings show up in a lot of business presentations. Top products by sales. Regions by revenue. Sales teams by deals closed. Your position in a market league table. And very often they show up as a table: items down the side, periods across the top, a rank in every cell.
The table has every number in it. What it doesn’t show is the movement, and the movement is usually the point. Who climbed? Who slipped? Who held the top spot all year? To answer any of those, the reader has to compare cells one row at a time and keep the earlier ranks in their head.
A bump chart draws the movement instead. This guide explains what a bump chart is, when it is the right choice (and when it isn’t), four rules for making one readable on a slide, and how to build it in PowerPoint and Google Slides.
Note: the products, ranks and sales figures in this article are illustrative, made up to show the method.
The problem with a table of ranks
Take a simple example: six products, ranked by sales in each quarter of the year. In a table it looks like this:
- Core: 1, 1, 2, 2
- Flex: 2, 3, 3, 4
- Go: 5, 6, 6, 6
- Lite: 3, 4, 5, 5
- Max: 6, 5, 4, 3
- Pro: 4, 2, 1, 1
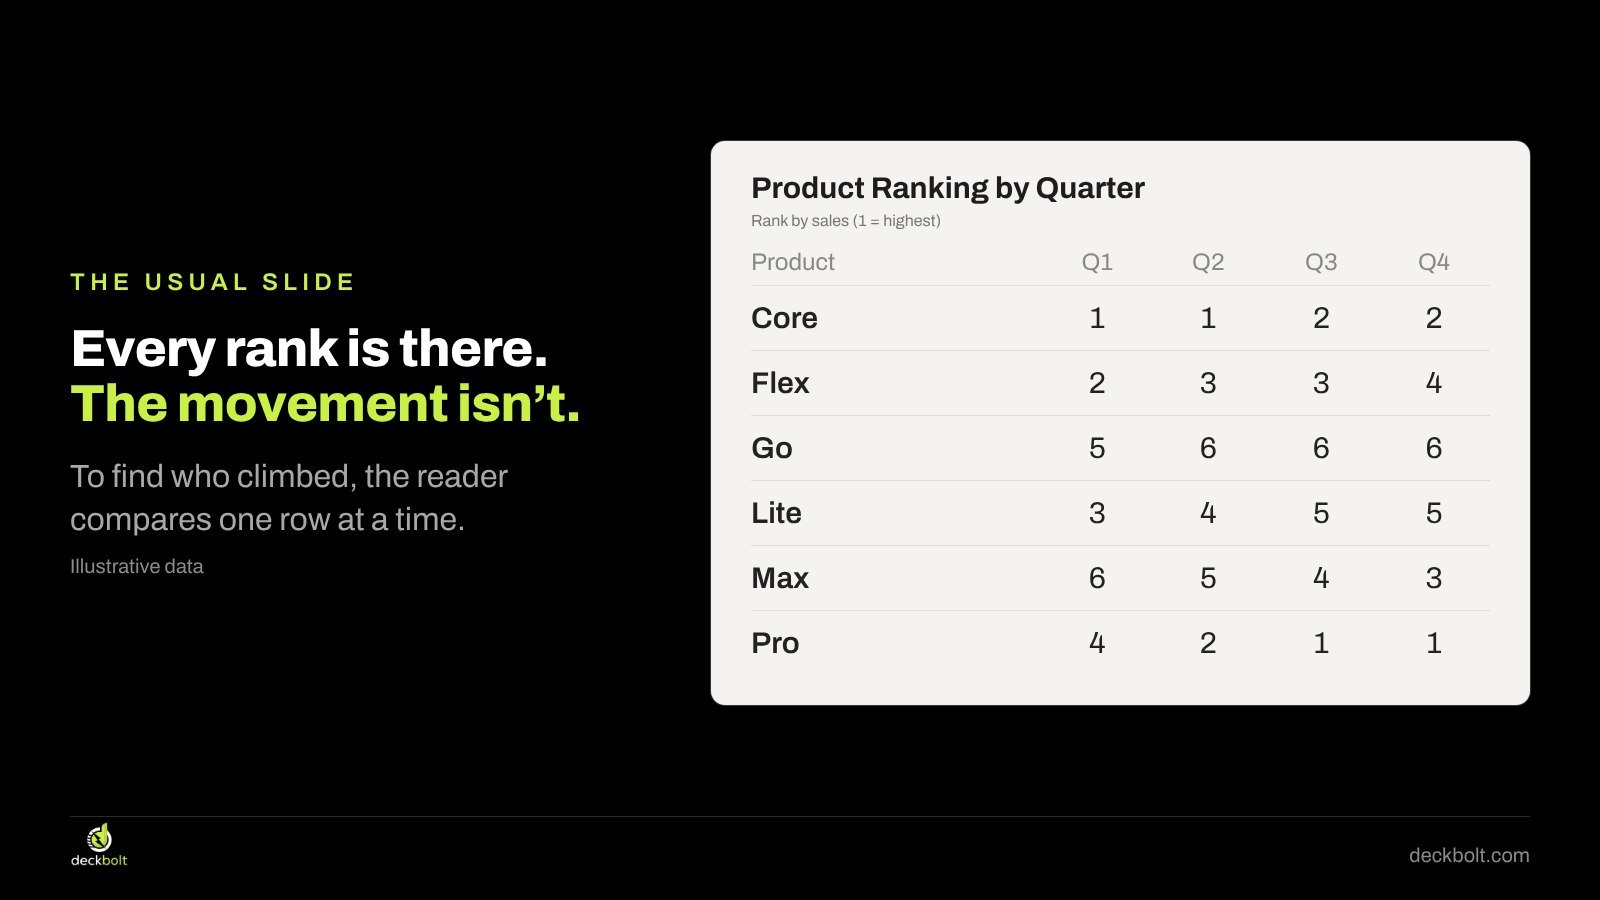
Twenty-four numbers, all correct. Now try to answer: which product climbed the most during the year? You can work it out, but you have to read every row, subtract, and compare. Most audiences won’t do that during a meeting, and nobody will do it while you’re talking.
Tables are good when people need to look up a specific value. We cover that in our guide to tables that make the answer findable. But when the message is a change in order over time, a table makes the reader do the visual work in their head.
What a bump chart is
A bump chart is a line chart of ranks. Each item gets one line. Each period gets one column. The vertical position is the rank, with rank 1 at the top. When one item passes another, their lines cross.
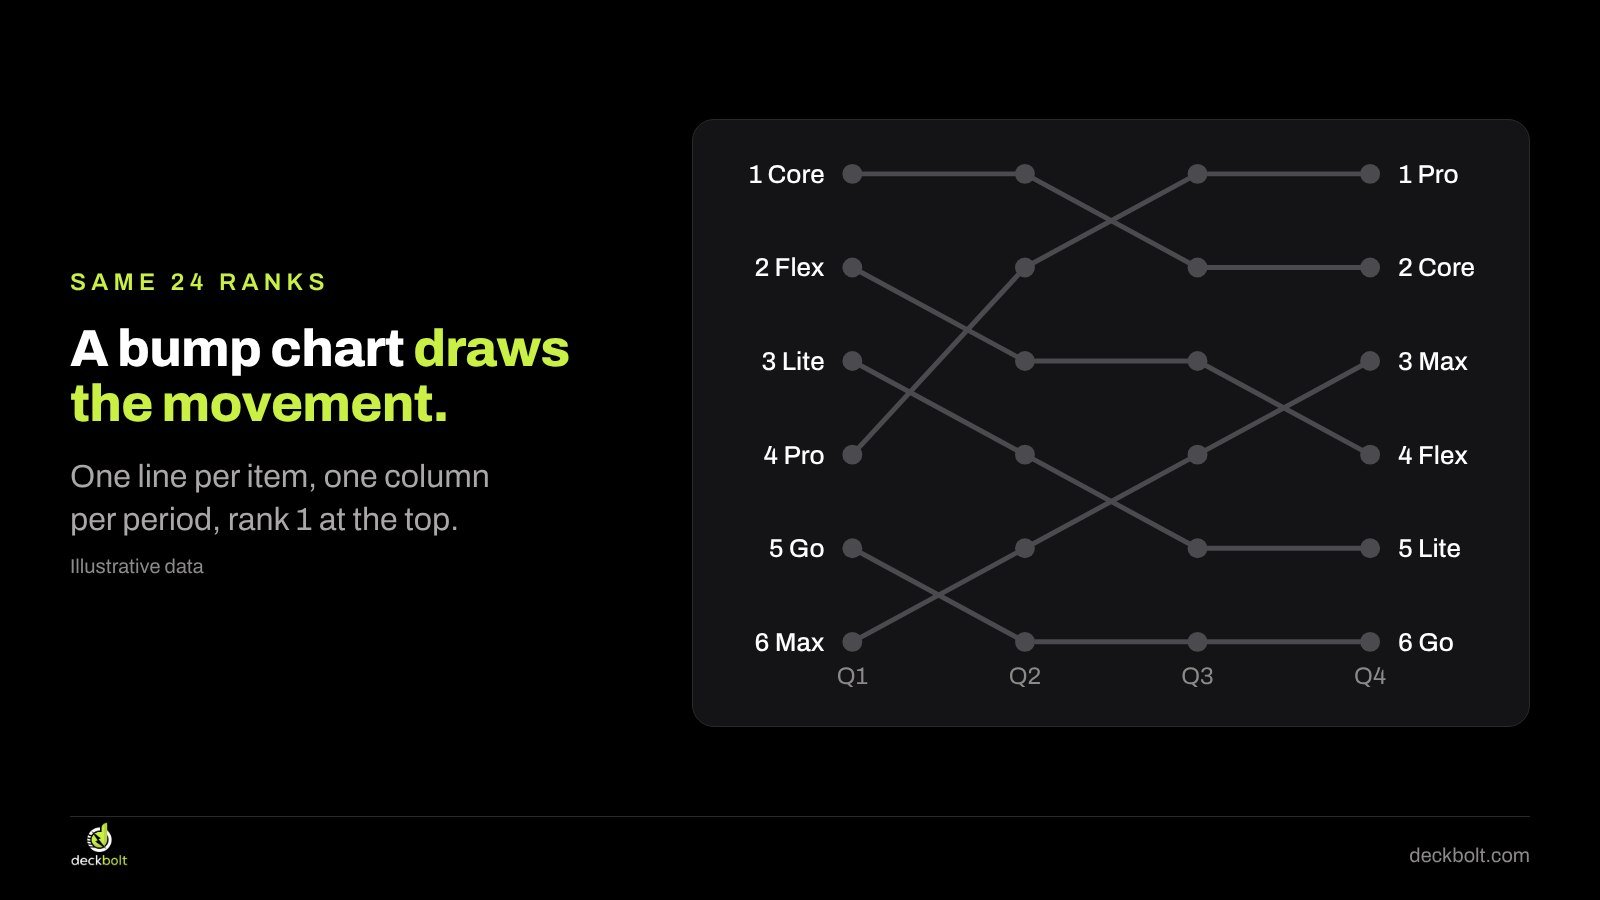
With the same 24 ranks drawn this way, the movement is visible in a second or two: Pro climbs from 4th to 1st, Max climbs from 6th to 3rd, and Lite slides from 3rd to 5th. Core holds near the top. Go stays at the bottom. You didn’t need to subtract anything.
That is the whole value of the chart: it turns a comparison the reader would have done in their head into a shape they can see.
First, check that rank is the story
A bump chart shows order, not size. That is its strength and its limit. Ranks hide the gaps between items.
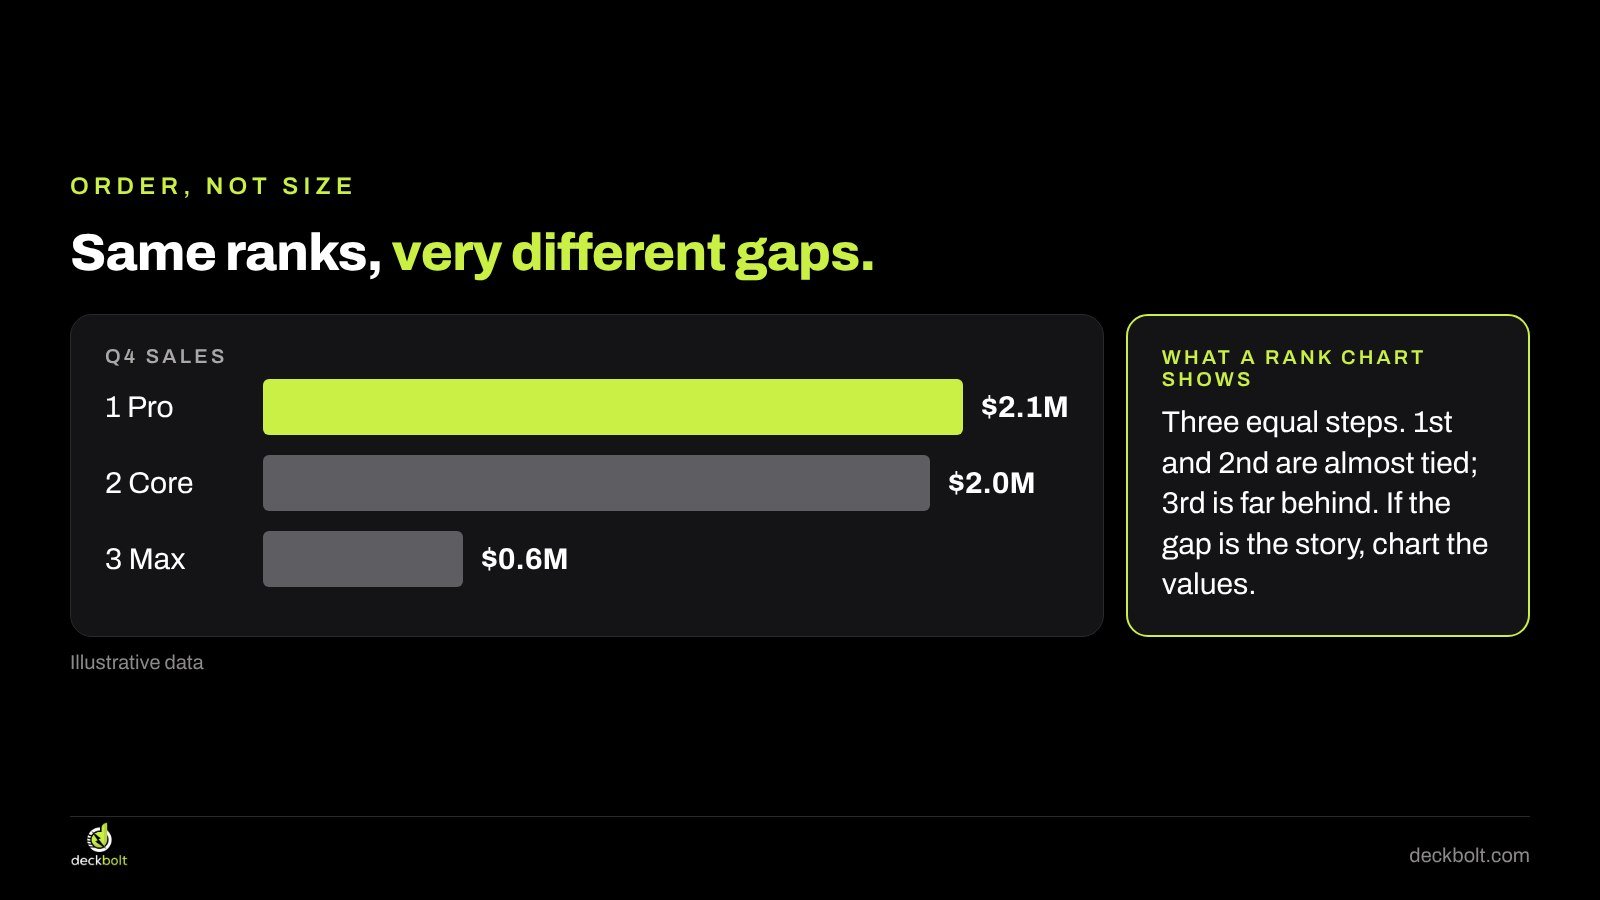
Imagine that in the last quarter Pro sold $2.1M, Core sold $2.0M and Max sold $0.6M. On a bump chart, they sit at positions 1, 2 and 3, three equal steps apart. In reality, Pro and Core are almost tied, and Max is far behind both. Anyone who reads the bump chart as a chart of sales will get the wrong picture.
So before you draw one, ask what the audience should take away:
- Rank is the story when position itself matters: a league table, a top-ten list, “we’re now the number one supplier in the region”, or which sales team finished first. A bump chart fits.
- Size is the story when the message is how far ahead someone is, totals, or growth. Chart the values instead: a line chart for change over time, sorted bars for one period.
If you’re unsure which chart a message needs, start with the question rather than the data. Our guide right data, wrong chart walks through that choice.
Rule 1: Put rank 1 at the top
Most chart tools put the lowest value at the bottom of the vertical axis. For ranks, that means rank 1 sits at the bottom and rank 6 at the top. The result is confusing: a product that climbs from 4th to 1st looks like it is falling.

Flip the axis so rank 1 is at the top. Now climbing looks like climbing, and the reader’s first impression matches the data. This single setting is the most common thing missing from bump charts made with default chart tools. The build steps are at the end of this article.
While you’re on the axis, set its range to exactly the ranks you show (1 to 6 here) and remove the gridlines and axis numbers if the lines are labelled. The labels do that job better.
Rule 2: Label both ends of every line, delete the legend
A default line chart gives every series its own color and puts a legend underneath. With six lines, that means six trips from the chart to the key and back, and colors that are hard to tell apart for some readers.
Instead, put the name and rank at both ends of each line: “4 Pro” on the left, “1 Pro” on the right. The reader sees where each item started and where it finished without looking anywhere else. Then delete the legend.
Labelling both ends matters on a bump chart in particular, because lines cross. Starting from a label on the left, the reader can follow one line across; starting from the right, they can trace it back. If your chart tool can’t place these labels neatly, text boxes aligned to the first and last points are perfectly acceptable for a slide.
Rule 3: Color only the line your title is about
Once the lines are labelled, you don’t need color to tell them apart. That frees color for its most useful job: pointing at the story.

Make every line gray, then color the one your title is about. In the example, the title is “Pro climbed from 4th to 1st in a year.” Pro is the only lime line; the other five are gray. The audience reads the title, finds the colored line, and sees the claim confirmed in the shape.
A topic title like “Product Ranking by Quarter” doesn’t give the reader anything to look for. Write the finding instead. If there are two stories, such as Pro climbing and Lite slipping, consider two slides with one colored line each. The same principle works for other charts with many lines, and our guide to radar chart alternatives applies it to multi-option comparisons.
Rule 4: Keep it small
Bump charts get crowded quickly. Every extra line adds crossings, and crossings are where readers lose track. A few limits help:
- Five to eight lines. With more than that, show the top five or so and say so in a note.
- Three to eight periods. Quarters or years usually work. With only two periods, a slope chart or a ranked list with up and down arrows is enough. With dozens of periods, the lines turn into noise.
- Mark who joins and who leaves. In a top-five list, items drop out and new ones enter. End a line where an item leaves, and label it “out of top 5”, rather than drawing it off the chart.
- Say how ties are handled. If two items had the same sales, do they share a rank? A one-line note under the chart avoids the question.
Before and after
Here is the same data on one slide, two ways. Before: a light table titled “Product Ranking by Quarter”, six rows by four columns, all numbers the same size. After: the title “Pro climbed from 4th to 1st in a year.” above a bump chart with rank 1 at the top, names and ranks at both ends, Pro in lime and the rest in gray.
The after slide uses the same 24 numbers. It just does the comparison for the reader and tells them what to look for.
Keep the full table available. Put it in the appendix or the handout, because someone may want to check a specific quarter. The slide’s job is to make the point; the appendix’s job is to answer the follow-up.
How to build a bump chart
In PowerPoint
- Insert → Chart → Line → Line with Markers.
- In the data sheet, put periods in the first column (or row) and one series per item, with the ranks as values.
- Select the vertical axis, open Format Axis, and tick Values in reverse order so rank 1 sits at the top. Set the minimum and maximum to your first and last rank.
- Delete the legend and gridlines. Add data labels to the first and last points (right-click the point → Add Data Label), and show the series name.
- Set every series to gray, then recolor the one in your title.
In Google Slides
- Build the chart in Google Sheets: select the data, Insert → Chart, and choose a line chart.
- In the chart editor, go to Customize → Vertical axis and tick Reverse axis order.
- Under Customize → Series, set each series’ color and point size; gray for all, your accent for one.
- In Google Slides, Insert → Chart → From Sheets, and pick the chart. Add text boxes for the end labels if needed.
If your version of a tool doesn’t offer a reversed axis, a common workaround is to chart a flipped value (for six items, 7 minus the rank) and hide the axis numbers, relying on the end labels instead.
Common mistakes
- Rank 1 at the bottom, so the winner looks like the loser.
- A rainbow of colors and a legend, with no line standing out.
- Too many items, so the crossings hide the story.
- Using ranks when the size of the gap is the message.
- A topic title that doesn’t say what changed.
A five-question check
- Is the position the story, not the size of the gaps?
- Is rank 1 at the top?
- Is every line named at both ends, with no legend?
- Is only the line in your title in color?
- Are there five to eight lines and three to eight periods?
For a wider look at matching chart types to messages, see our guide to choosing the right chart for business presentations.
Want your charts to make the point?
DeckBolt designs pitch decks, sales and executive presentations where every chart says one thing, in PowerPoint and Google Slides. Request a free deck review and we’ll tell you the three slides we’d fix first.