
Org charts turn up in more decks than people expect: the team slide in a pitch deck, the “your project team” page in a proposal, the leadership slide in a board pack, the new structure in a reorg announcement. Most of them are built the same way. Someone exports the full company chart, pastes it onto a slide and shrinks it until it fits. Forty boxes, tiny names, titles like “Sr. Mgr, BI & DE” and a tangle of lines.
It looks complete, and it answers almost nothing. This guide is for anyone who puts people on slides: founders, consultants, sales teams and internal comms. It covers why org charts fail on slides, five fixes that make them useful, how to build them cleanly in PowerPoint and Google Slides, a before-and-after walkthrough and a short checklist.
Why most org chart slides fail
A full company org chart is a reference document. It answers one question: who reports to whom. That is useful for HR and for new joiners finding their way around. On a slide, though, the reader almost never arrives with that question. They come with a narrower one, and they have a few seconds to find the answer.
Three things usually go wrong:
- Too many boxes. To fit forty people on one slide, every box and every name shrinks. On a laptop it’s hard to read; on a phone or a projector it’s unreadable.
- Titles instead of roles. Job titles describe rank and department, often in internal shorthand. They rarely say what the person will do for the reader.
- No point. Every box looks the same, so nothing tells the reader where to look first.

Start with the question the chart answers
Before you draw a single box, decide which question this slide answers. In most decks it is one of three:
- Who leads this? Pitch decks and board decks. The reader wants to know who runs the company and whether those people can deliver the plan.
- Who do I call? Proposals, kickoff decks and account plans. The reader wants to know who they will work with and who their main contact is.
- What changed? Reorg and all-hands announcements. The reader wants to know what’s different and what it means for them.
Each question needs a different chart. The leadership chart might be five boxes. The project team might be four people with one highlighted. The reorg chart needs before and after. One full chart can’t do all three jobs, which is why it ends up doing none of them. This is the same principle as building any slide around one message; our guide to finding the diagram hiding in a bullet list covers how to pick the right shape for the idea.
Fix 1: cut to the boxes that answer it
Once you know the question, remove every box that doesn’t help answer it. For “who leads this?”, that usually means the CEO and the people reporting directly to them: perhaps five boxes instead of forty-one. Those five can now be large enough to carry a name, a role and even a photo or one line of background.

A few practical notes:
- Pitch decks: show founders and key hires. Open roles you plan to fill with this round can appear as dashed boxes, which tells investors where the money goes.
- Need the full chart anyway? Put it in the appendix and say where it is. Readers who want the detail can find it; everyone else gets the answer.
- Deep structures: if a team matters, give it its own slide rather than squeezing a third and fourth level onto the first one.
Fix 2: write roles in plain words
A job title says where someone sits in the company. The reader usually wants to know what that person does, and what they will do for them. Compare:
- “Maria Lopez, VP, Ops EMEA” → “Maria Lopez: runs delivery for your project. Your day-to-day contact.”
- “David Chen, Sr. Mgr, BI & DE” → “David Chen: builds your reports and data feeds.”
Names and roles here are illustrative.
Write the role for the reader, not for the HR system. Drop acronyms the reader would have to ask about. If the title matters, for example in a board deck where seniority is the point, keep it as a second, smaller line under the plain-language role.
Fix 3: highlight one person, gray the rest
If one person matters most to the reader, make that obvious at a glance. In a proposal, it’s usually the main contact. In a reorg, it might be the new leader of a combined team. Use your accent color for that one box and keep every other box neutral.
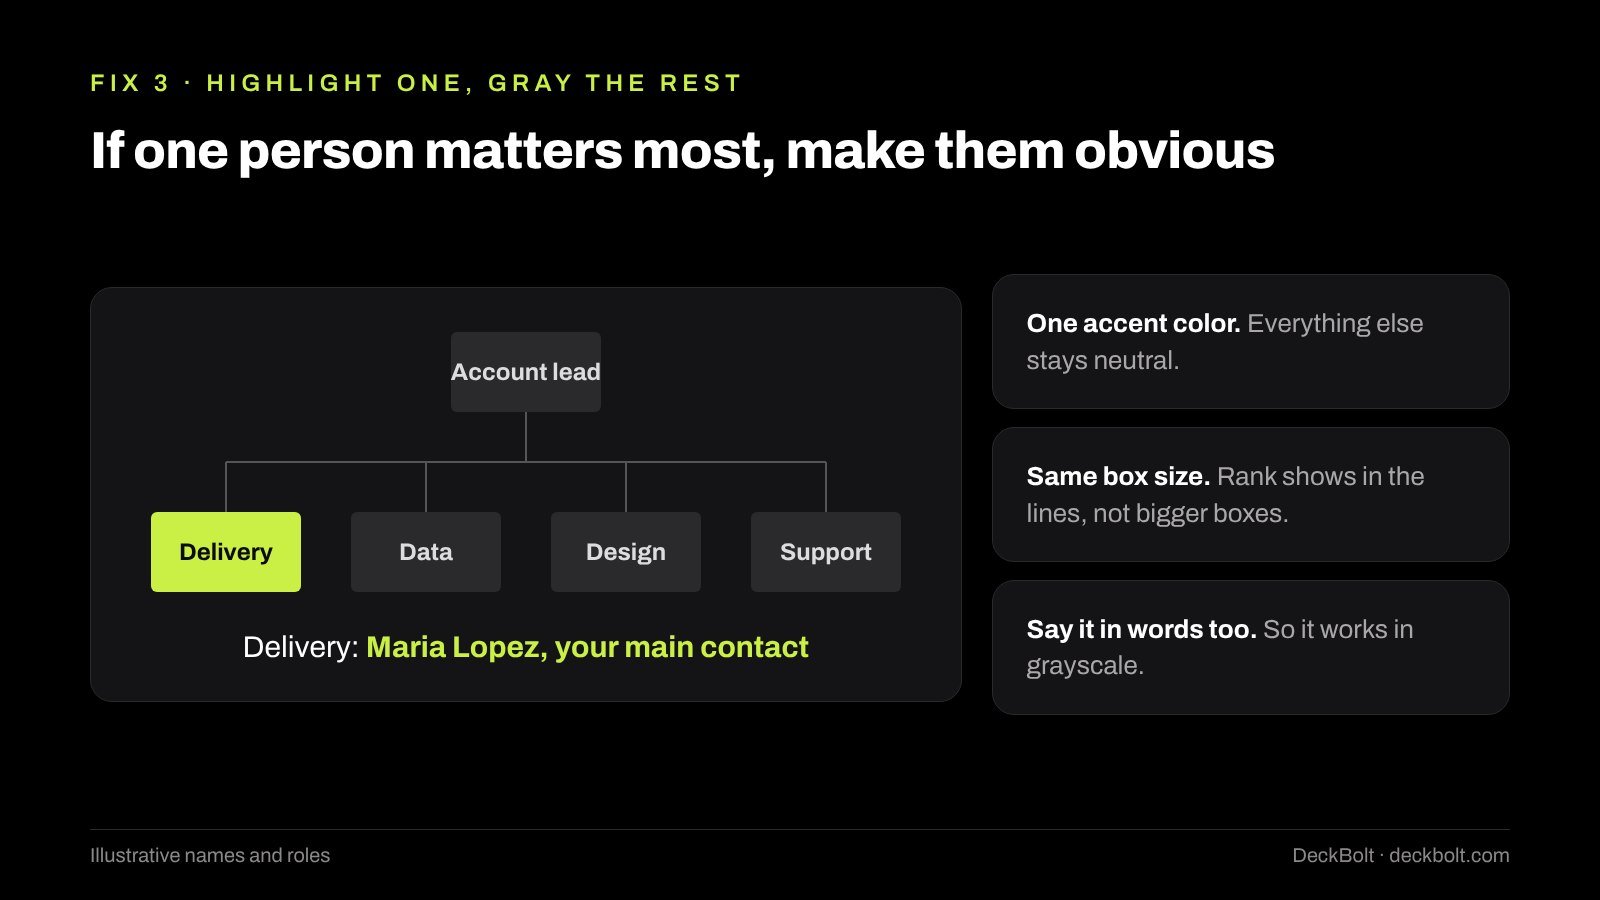
Two details make this work:
- One accent, one meaning. If you also use the accent color for decoration, the highlight stops meaning anything.
- Same box size for everyone. Rank already shows in the lines. Making senior people’s boxes bigger adds noise and makes the chart harder to align.
Put the reason for the highlight in words too, for example “Delivery: Maria Lopez, your main contact” under the chart, so the slide still works when printed in grayscale.
Fix 4: for a reorg, show what changed
When a structure changes, showing only the new chart forces people to compare it with the old one in their heads. Most can’t, so they miss the change you wanted them to see. Instead, show before and after side by side, and mark the moves.
In an illustrative example, customer success and support move out of Sales and Product into a new customer team from January. The “before” side shows the old teams in neutral gray; the “after” side shows the new team with the two moved groups in the accent color and labeled “moved”. The slide title states the news in a sentence: “Support and success now sit in one customer team.”
Then answer the question everyone in the room is asking: who do I go to now? A short line or a follow-up slide with “for X, go to Y” does more for adoption than a perfectly drawn chart.
Fix 5: build it so it stays tidy
Hand-drawn org charts drift. A box moves, a line stays behind, and the spacing goes uneven after the third edit. Let the software hold the structure for you.
In PowerPoint: Insert → SmartArt → Hierarchy gives you a quick org chart that adds and re-spaces boxes as you type. For more control over the look, draw boxes with shapes and join them with elbow connectors (Insert → Shapes, under Lines). Connectors attach to the shapes, so they follow when you move a box.
In Google Slides: Insert → Diagram → Hierarchy gives you a starting layout you can edit. Or use shapes with elbow connector lines, which snap to the connection points on each box.
In both: use one box size, then use the align and distribute tools so spacing is even. Keep names at least as large as your body text. A useful check is to view the slide at phone size; if a name can’t be read there, the chart has too many boxes. Our guide to slide layout grids covers how to keep spacing consistent across a deck.
Before and after: a proposal team slide
This example is illustrative: the company, names and roles are made up.
Before: a slide titled “Organization Structure” with the vendor’s full chart: a CEO, four department heads, twelve managers and twenty-four team members, forty-one boxes in all. The client’s project team is somewhere in there, but nothing shows where, and the names are too small to read.
After: a slide titled “Your project team: four people, one main contact.” Four rows, each with a name and a plain role: Maria Lopez, runs delivery (your day-to-day contact, highlighted); David Chen, reports and data feeds; Sara Ahmed, screens and design; Tom Reyes, support after launch.
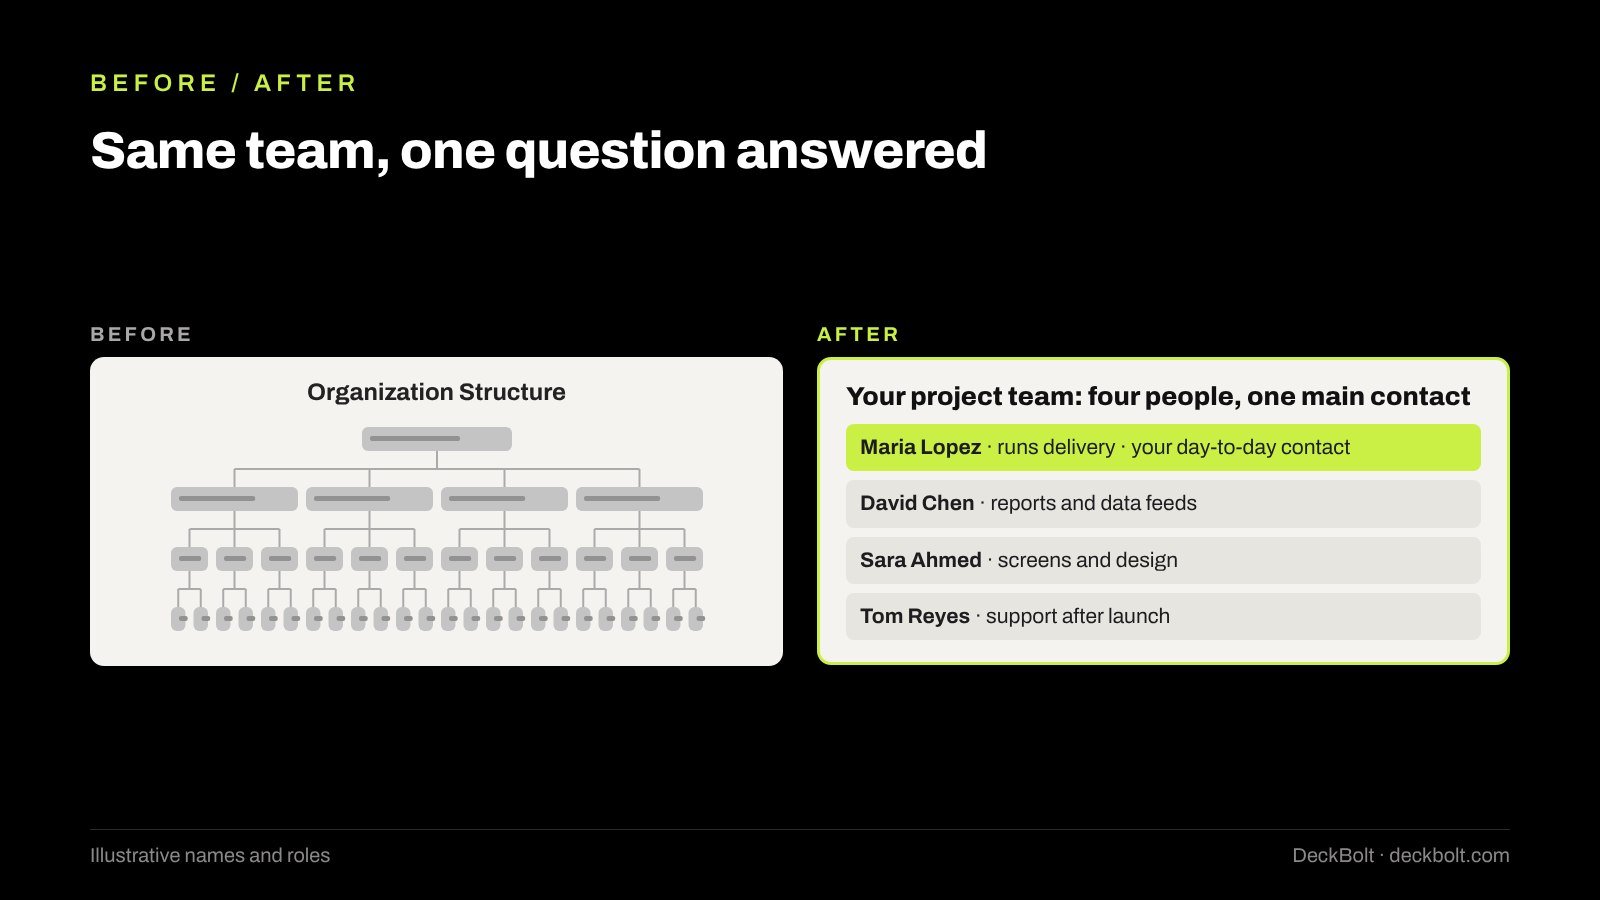
The “after” slide has fewer people on it, but it answers the client’s real question in a few seconds and gives them a name to call. That is what the slide was for. It also fits naturally into a client kickoff deck, where who-does-what is one of the first things a new client wants settled.
Common mistakes to avoid
- Pasting the HR export. It’s built for a different question and a bigger screen.
- Photos of uneven quality. If you use headshots, they need the same crop, size and style, or leave them out.
- Decorative icons in every box. A briefcase or a gear next to each name adds clutter without meaning; see our guide to icons in presentations.
- Inconsistent names. If the same team is “Ops” on one slide and “Operations” on another, readers wonder whether they’re different teams.
- Out-of-date charts. A chart showing someone who left last quarter undermines the rest of the deck. Check it every time the deck goes out.
Checklist: before you send it
- Which question does this chart answer?
- Is every box on it needed for that answer?
- Does each role say what the person does?
- Is the person who matters most highlighted?
- For a reorg: are the moves marked?
- Can you read every name on a phone?
Fewer boxes, clearer roles. An org chart on a slide should answer its question in about five seconds.
Note: the examples, names and roles in this article are illustrative.
Working on a proposal, a board pack or a reorg announcement that matters? DeckBolt designs corporate, sales and investor presentations in PowerPoint and Google Slides. Request a free deck review.