
Put a forecast on a slide and something odd happens. A guess about next quarter picks up the authority of the chart around it. Same axis, same line, same confident slope as the months that already happened.
Many forecast charts are drawn exactly this way: one solid line from January to December. At a glance, nobody can tell which months are real. The chart looks like a fact, and the person presenting it inherits a promise they never meant to make.
This guide is for founders, finance leads and anyone presenting a forecast to investors, a board or a leadership team. It covers five fixes that make a forecast honest without making it look weak, plus how to build them in PowerPoint and Google Slides.
Why one solid line overpromises
People read a chart’s shape before they read its labels. So a single solid line makes three promises, whether you mean it to or not.
- “This already happened.” Nothing marks where real numbers stop and expectations start.
- “This is exact.” One thin line says December will land on one number.
- “This is the only path.” Nothing shows what could push the result higher or lower.
The cost arrives later. When the actual number misses the line, even by a little, the conversation turns to why you missed. If the chart had shown a range, the same result might have been inside it. You’re not trying to protect yourself with vagueness. You’re trying to show what you actually know, including how sure you are.
It also helps the reader. An investor or board member doesn’t expect you to predict the future. They want to see how you think about it, which is why we argue that investors fund what’s under the hockey stick, not the curve itself.
Fix 1: split the line at today
Start with the simplest change. Draw actuals as a solid line and the forecast as a dashed line in a different color, and mark the point where one becomes the other.
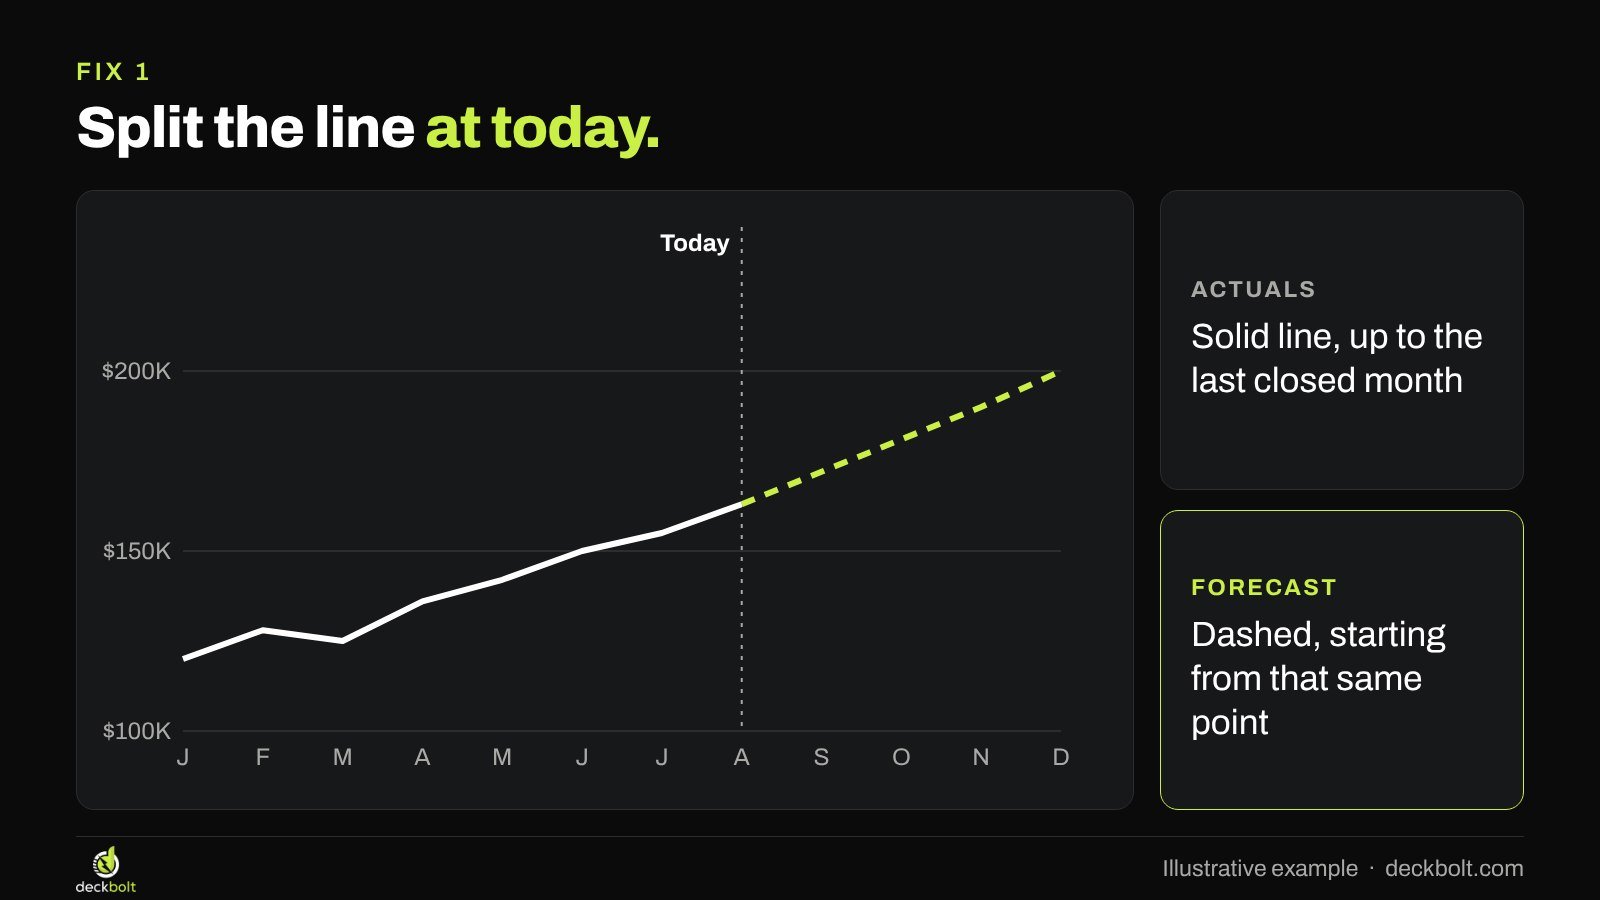
Three details make this work. First, start the dashed line from the last actual point so the two lines join, with no gap. Second, label the split. A thin vertical line and the word “Today” are usually enough, or use the date of the last closed month. Third, keep the last point honest: if the current month isn’t finished, it belongs on the dashed side.
The same idea works for bars: solid fill for actuals, lighter or outlined bars for forecasts. Either way, the reader should be able to find the split without reading the legend.
Fix 2: show a range, not a line
A forecast is a best guess inside a set of possible results, so show the set. A shaded band around the dashed line does this in one glance: narrow near today, wider further out.

The widening shape matters. It says something true and useful: you know more about next month than you do about next December. A band that stays the same width all the way out suggests you added a flat percentage for appearances.
So build the band from something real. The low edge and high edge should each come from a set of assumptions you could defend in the room, not from adding and subtracting 10%. If you don’t have enough history for that, two clearly named cases will do more than a band that looks scientific.
Keep the band quiet: a light tint, no outline, and a bright dashed line in the middle. The range is context. The central expectation should still be the first thing people see.
Fix 3: don’t forecast to the dollar
Precision signals confidence. A number like $200,417 tells the reader that someone calculated this and is sure of it. Spreadsheets produce numbers like that without effort, but nobody knows next December to the dollar.

Round forecast numbers more than you round actuals. “About $200K” is better. “$170K to $230K” is better still, because it carries the uncertainty in the words as well as the picture. Use the same rounding wherever the figure appears, and make sure your headline, chart labels and appendix agree.
Fix 4: say what moves the edges
A range with no reason behind it looks like a shrug. The reader’s next question is obvious: what would put us at the top, and what would put us at the bottom?
Answer it on the slide. Here’s an illustrative example for monthly revenue in December:
- High, $230K: the new plan launches in October.
- Base, $200K: the new plan launches in November.
- Low, $170K: the launch slips to next year.
Notice that one driver explains the whole range. That’s often enough. When you name the one thing that matters most, the chart turns into a decision: if the launch date is the swing factor, the meeting can talk about the launch date. We make a similar case for showing the assumptions behind your financial projections.
Fix 5: show how your last forecast did
The strongest support for a forecast is a track record. If you made a forecast in January, plot it against what happened, as a dashed gray line next to the actual line.
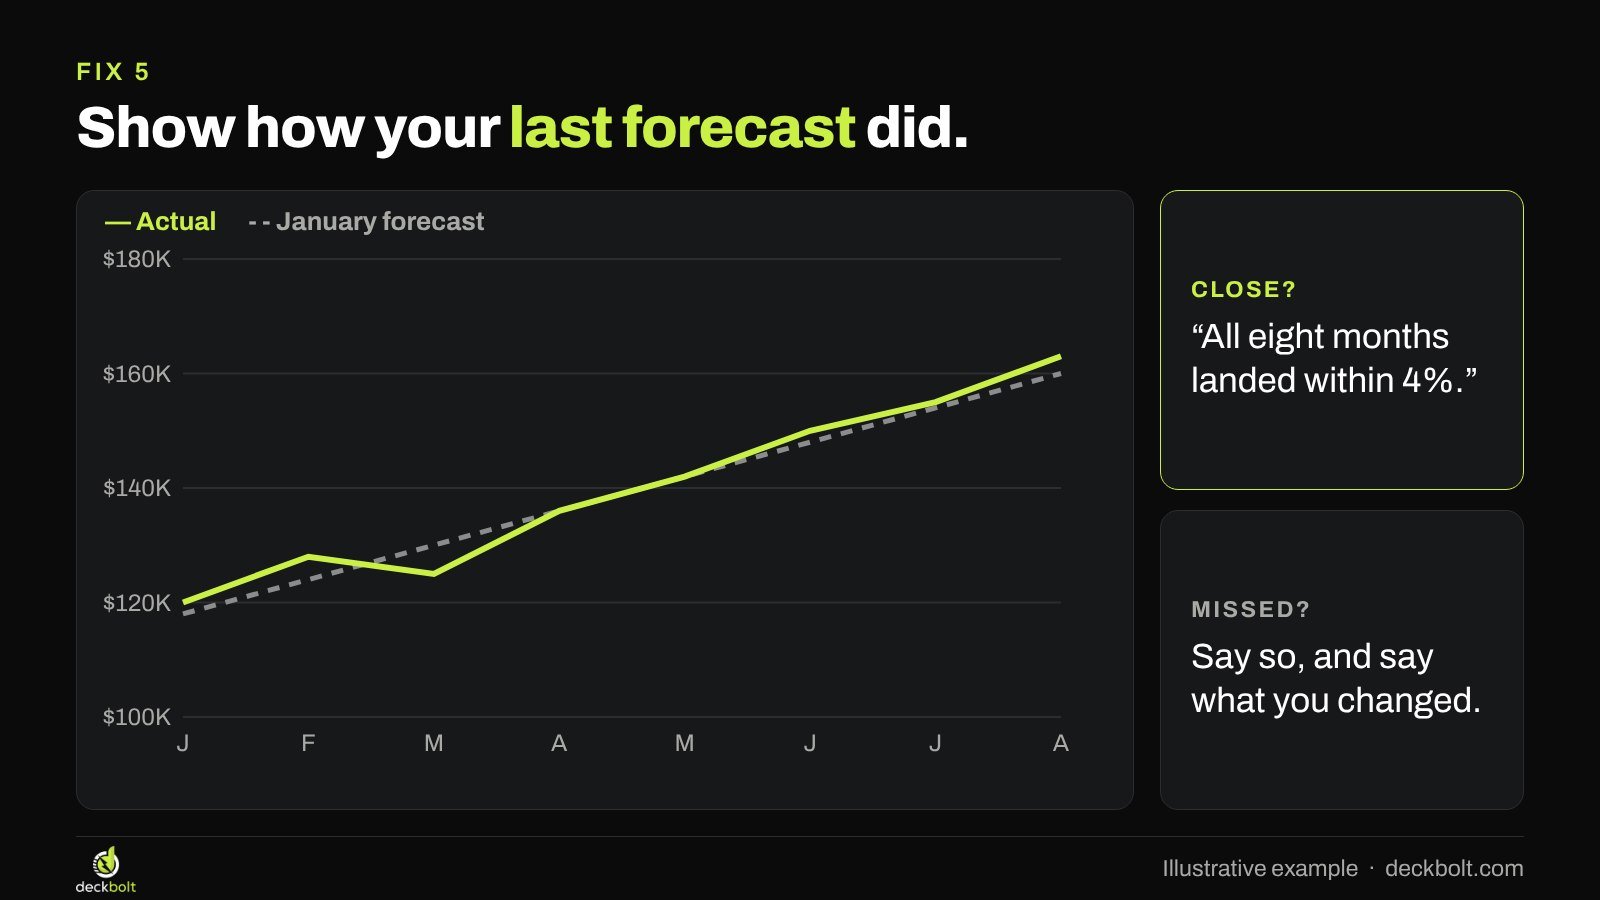
If the two lines stay close, say so: “All eight months landed within 4%.” That single line does more for the next forecast than any amount of explanation.
If they don’t stay close, show it anyway. Say what you missed and what you changed in the model. A founder or finance lead who can explain a miss clearly often comes across better than one who never mentions it. In a board deck, this comparison belongs in the regular pack, so people get used to reading it.
A before and after
Here’s the same illustrative data, twice. The first slide has the title “Revenue forecast” and one solid line. It tells the reader nothing about what’s real, how sure you are, or what could change.
The second slide has the title “Monthly revenue should reach $170K to $230K by December.” Actuals are solid up to today. The forecast is dashed, inside a band that widens. Add a short note on the slide to say what the range depends on.
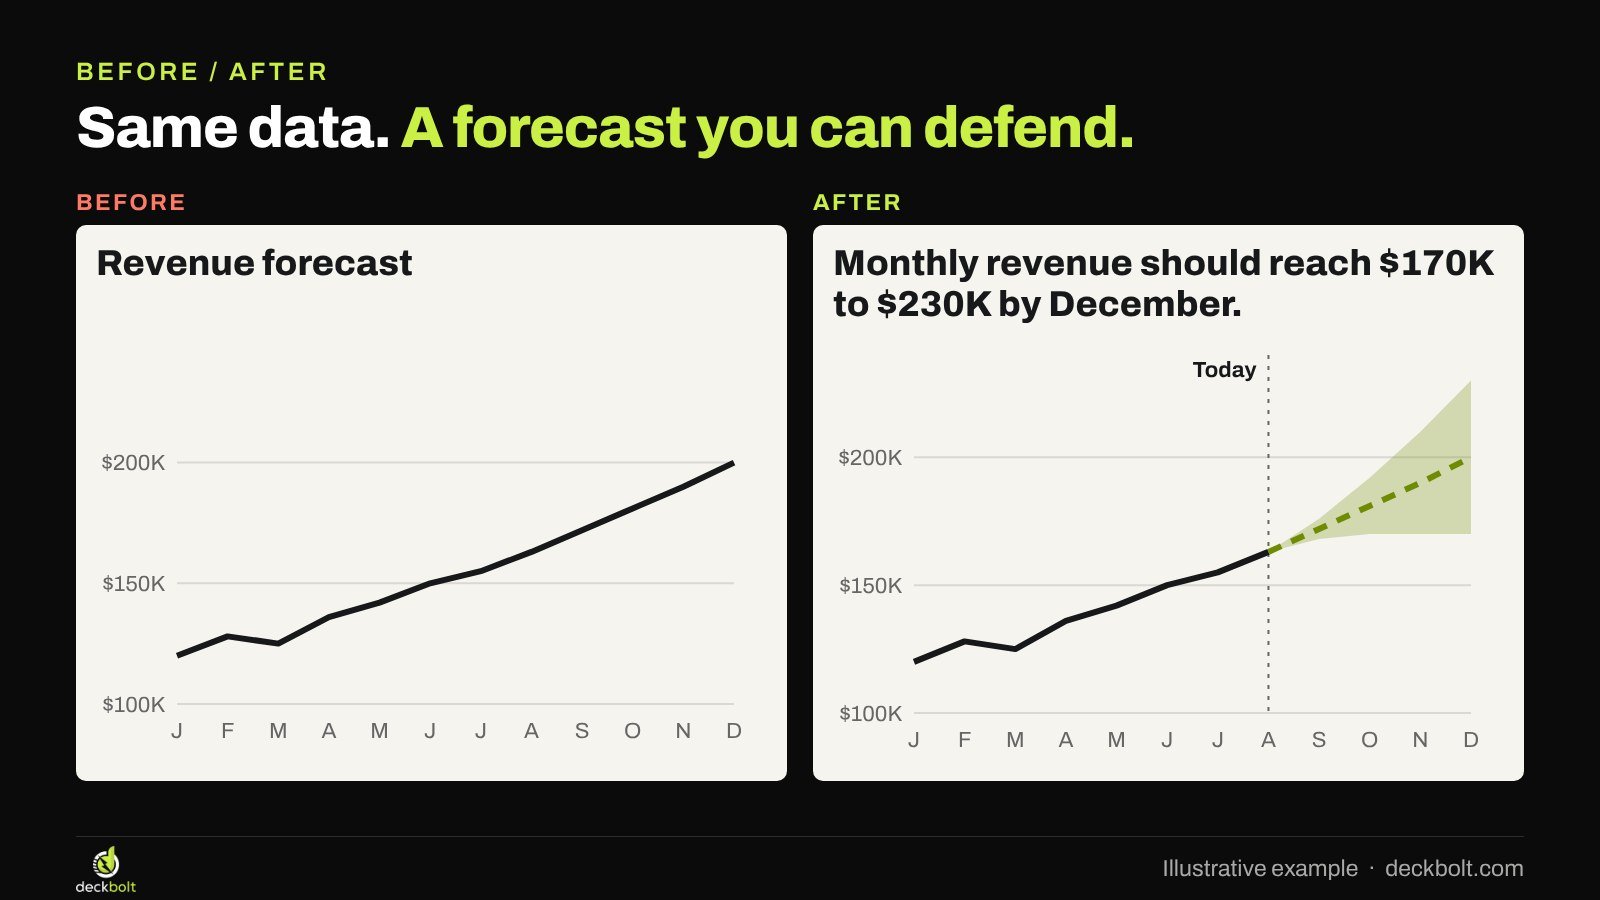
Nothing about the data changed. But the second slide answers the questions a careful reader would otherwise have to ask, and it gives the presenter something to talk about other than whether the line is right.
What to say when you present it
A range changes how you talk through the slide. Don’t read the band out loud. Give the central number, then the reason for the spread: “We expect about $200K a month by December. The launch date is what moves it. If we ship in October, we’re closer to $230K. If it slips to next year, closer to $170K.” Then stop and let people ask about the launch.
That takes a few seconds, and it moves the discussion from whether the forecast is right to what would change it. If someone asks for one number, give the base case and say that’s what it is. And put the same sentence in the slide’s title or notes, so the point survives when the deck gets read without you.
How to build it in PowerPoint
Set up the chart’s data with these columns: Month, Actual, Forecast, Low and Range, where Range is High minus Low. Put the last actual value in the Forecast column too, so the lines join. Leave the later Actual cells empty.
- Go to Insert → Chart → Combo.
- Set Actual and Forecast to Line, and set Low and Range to Stacked Area.
- Select Low, then use Format Data Series → Fill → No fill.
- Give Range a light tint with no border.
- Select Forecast, then use Format Data Series → Line → Dash type.
- Delete the legend and label the lines directly. Add a thin vertical line and a “Today” label, then group them with the chart.
How to build it in Google Slides
Build the chart in Google Sheets and bring it into your deck. The simplest range in Sheets is two thin lines, one for low and one for high, around a dashed forecast.
- Lay out the data with columns for Actual, Forecast, Low and High.
- Select it and use Insert → Chart, then choose a line chart.
- In the chart editor, go to Customize → Series, pick Forecast and set the Line dash type.
- Make Low and High thin and pale.
- In Slides, use Insert → Chart → From Sheets.
If the chart needs a different form altogether, our guide to starting with the question will help you choose.
Common mistakes
- A gap between the lines. If the forecast starts a month after the last actual, the chart seems to skip time.
- A flat percentage band. Plus or minus 10% all the way out says you didn’t think about what changes over time.
- Three scenario lines with no labels. Readers can’t use a range they can’t explain.
- A band so wide it says nothing. If the low case and high case lead to different decisions, say so. If you can’t narrow it, name what you’d need to learn.
- Only forecasting up. A low case that’s still great growth reads as optimism, not a range.
- Changing styles between slides. If a forecast is dashed on one slide and solid on the next, the code stops working. Pick one style and keep it across the whole deck.
A five-question check
- Can people see where actuals stop?
- Is the forecast styled differently from the actuals?
- Is there a range, not just one line?
- Are the numbers rounded?
- Do you say what moves the range?
The examples and numbers in this article are illustrative. Menu names can vary between versions of PowerPoint and Google Sheets.
Presenting a forecast to investors or a board? DeckBolt designs investor, board and executive decks with charts that make the point clear, in native PowerPoint and Google Slides. Request a free deck review.