
Part of our complete guide to presenting financials in a pitch deck.
Nobody believes a three-year revenue curve will land exactly where you drew it, and investors do not expect it to. They read your projections slide for something else: to see whether your thinking holds up. The curve is a guess. What matters is showing what it rests on.
An illustrative example
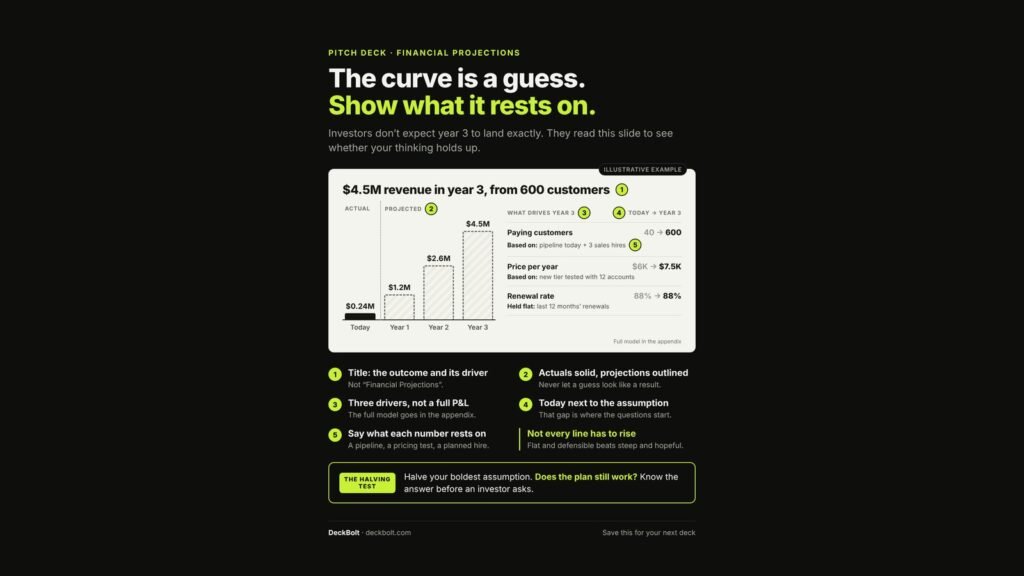
The headline reads “$4.5M revenue in year 3, from 600 customers.” On the left, a bar chart: today’s actual revenue of $0.24M as a solid bar, then projected years of $1.2M, $2.6M and $4.5M drawn as outlined bars. On the right, the three things that drive year 3:
| Driver | Today → Year 3 | What it rests on |
|---|---|---|
| Paying customers | 40 → 600 | Pipeline today + 3 sales hires |
| Price per year | $6K → $7.5K | New tier tested with 12 accounts |
| Renewal rate | 88% → 88% | Held flat: last 12 months’ renewals |
A small note points to the full model in the appendix.
The five rules behind it
1. Title: the outcome and its driver
Not “Financial Projections”. “$4.5M revenue in year 3, from 600 customers” tells the reader both the destination and what gets you there.
2. Actuals solid, projections outlined
Never let a guess look like a result. Draw what has happened in solid colour and what you expect in outline or a lighter tint, with a clear line between them.
3. Three drivers, not a full P&L
A full profit and loss statement on one slide is unreadable. Show the two or three inputs that move the number most. The full model goes in the appendix.
4. Today next to the assumption
Put the current figure beside the year-3 figure for each driver. That gap is where the questions start, so make it easy to see.
5. Say what each number rests on
A pipeline, a pricing test, a planned hire. One short line per driver turns an assumption into a plan an investor can question sensibly.
Not every line has to rise
In the example, the renewal rate stays at 88% from today to year 3. Flat and defensible beats steep and hopeful. A projection where every single number climbs reads as optimism, not analysis.
The halving test
Halve your boldest assumption. Does the plan still work? Know the answer before an investor asks, because they will.
All figures are an illustrative example. For more on presenting numbers, see How to Present Financials in a Pitch Deck Without Losing the Room and Your Use-of-Funds Pie Chart Answers the Wrong Question.
Preparing your financials slide? Send your deck for a free deck review and we will show you where an investor’s questions will start.
Need an investor pitch deck designed? See our investor pitch deck design services.