
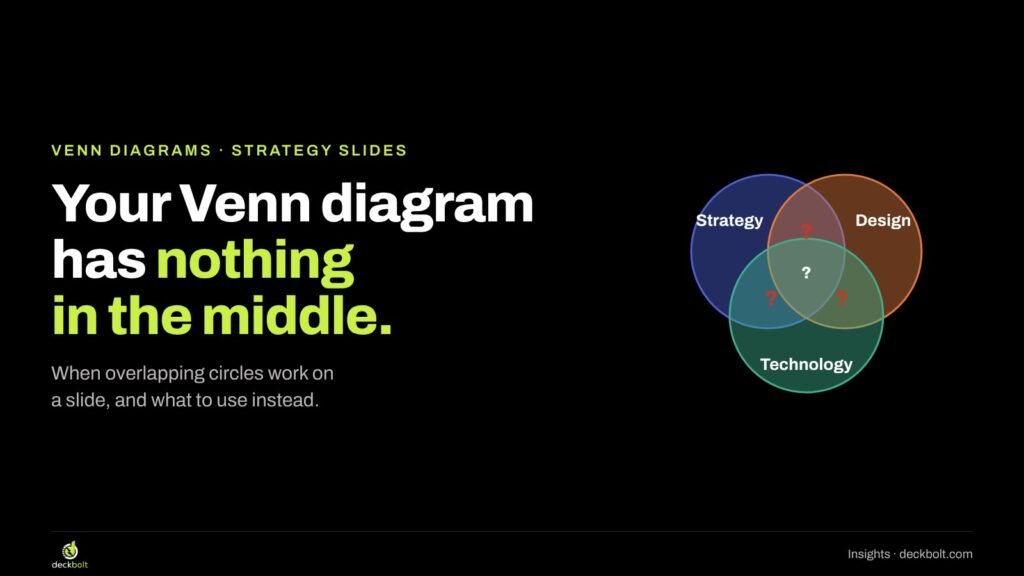
Open almost any strategy deck, agency credentials deck or “our approach” slide and you’ll find it: three overlapping circles labelled something like Strategy, Design and Technology, with the company name sitting in the middle where all three meet.
It looks thoughtful. It suggests that the team works where disciplines meet, that the whole is more than the parts. But if you stop and ask a simple question, most of these diagrams fall apart: what actually sits in each overlap?
This guide is for anyone who builds strategy, sales or pitch decks and reaches for circles when they want a slide to look like insight. We’ll cover what a Venn diagram really promises, a quick test for whether yours keeps that promise, and four alternatives that usually say more, with how to build each one in PowerPoint and Google Slides.
What a Venn diagram promises
A Venn diagram is a picture of groups. Each circle is a set of things: customers, products, skills, people. Where two circles overlap, the diagram says there are members that belong to both groups. Where they don’t overlap, there are members that belong to only one.
That’s the whole promise, and it’s a precise one. If you draw a circle for “customers who use the app” and another for “customers who use the website”, the overlap is real: it’s the customers who use both. You could count them. You could name some of them.
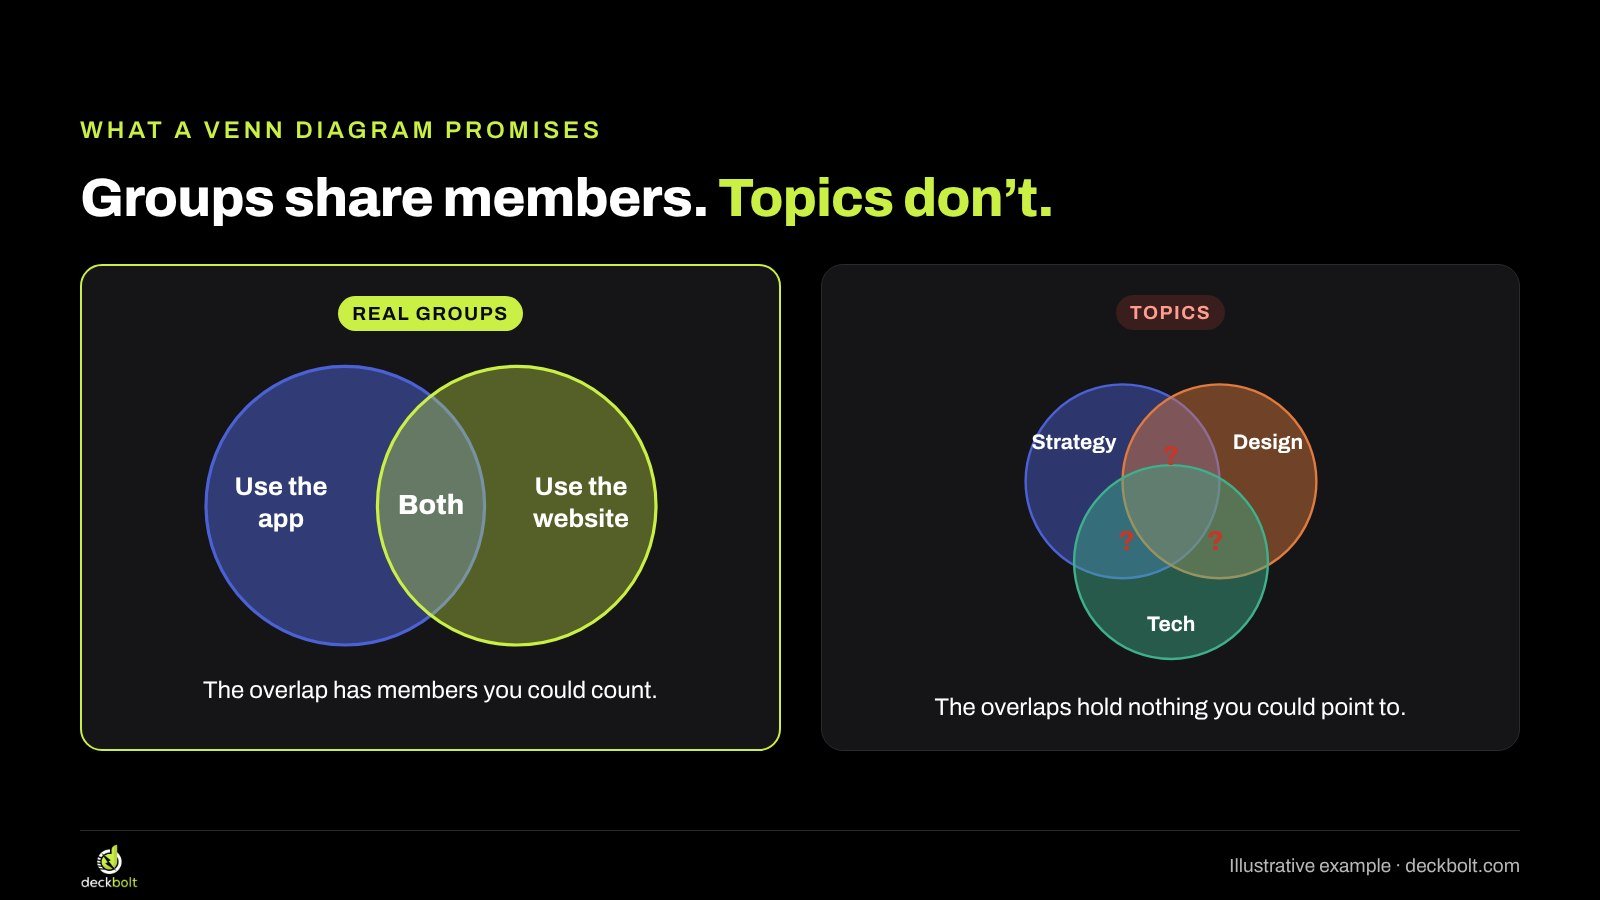
Now look at the typical strategy slide. The circles aren’t groups at all. They’re topics, or departments, or values. “Strategy” isn’t a set of members, and neither is “Design”. So the overlap between them doesn’t contain anything you could point to. The diagram has borrowed the shape of a Venn without its meaning.
Readers notice this, even if they can’t say why. Their eyes go to the overlaps, because that’s where a Venn diagram puts its information, and they find nothing there. At best, the slide reads as decoration. At worst, it reads as a claim the presenter couldn’t back up.
Why we keep drawing them
There are good reasons the empty Venn is so common. It’s in the template: PowerPoint’s SmartArt gallery offers a Basic Venn under Relationship, one click away. It fills space nicely. And it lets a team say “we combine these things” without having to explain how.
That last reason is the real one. The empty Venn is often a placeholder for a sentence nobody has written yet. “We sit where strategy, design and technology meet” sounds like a position. But it doesn’t tell a client what they’ll get, and it doesn’t tell an investor why the combination matters. The circles cover the gap.
So the fix usually isn’t a better diagram. It’s deciding what you’re really trying to say, then choosing the shape that says it.
The overlap test
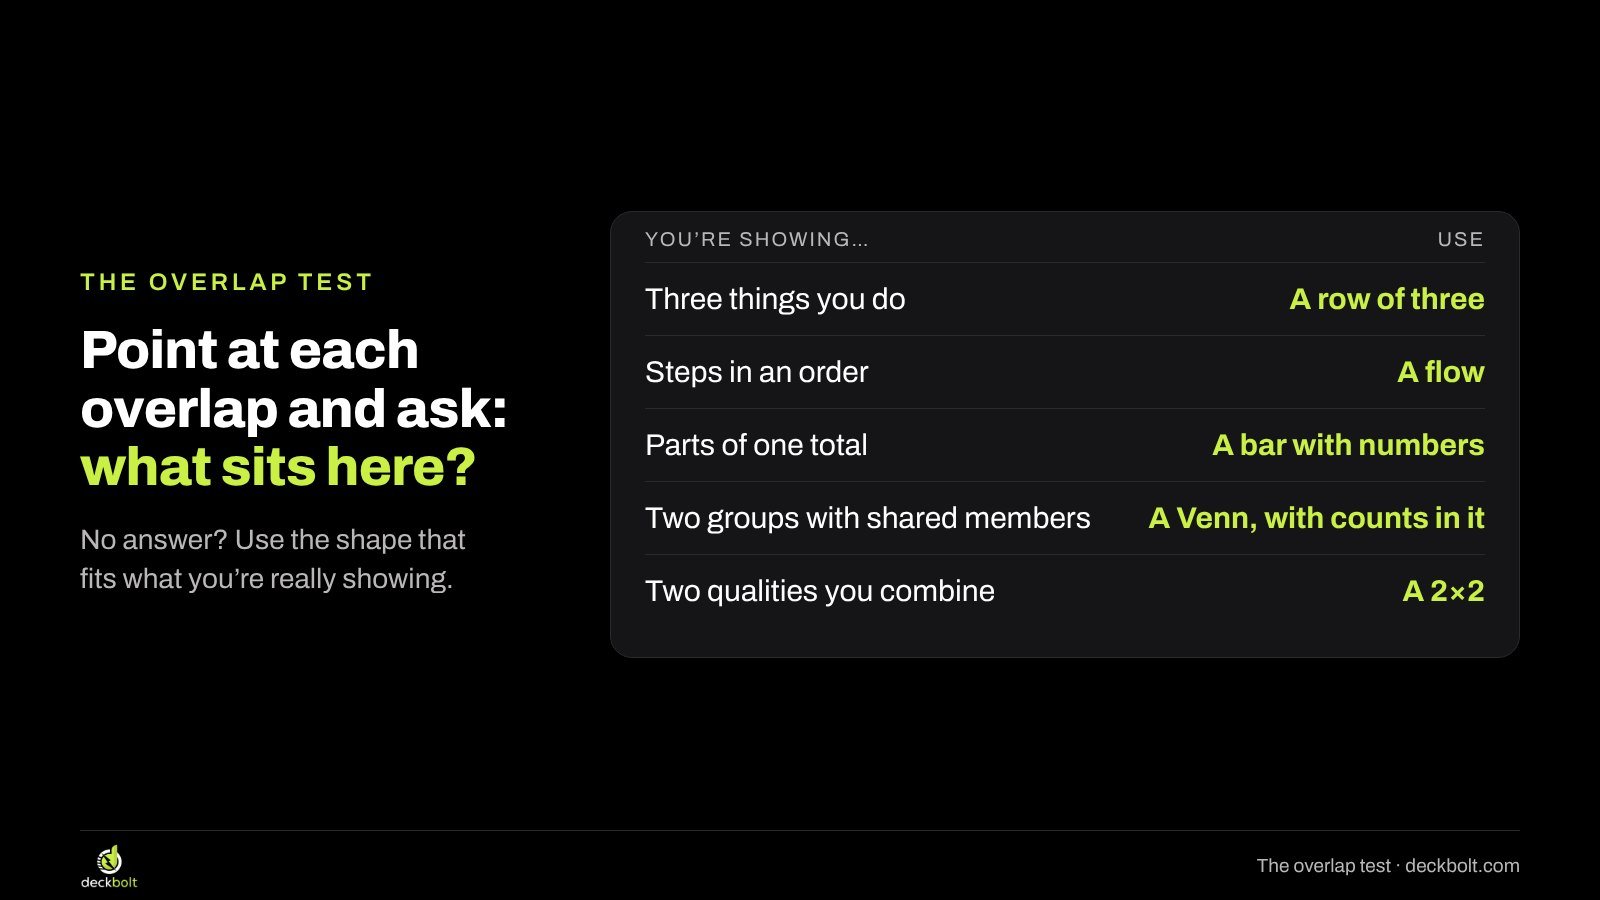
Before you keep a Venn diagram, point at each overlap and ask: what sits here? Be specific. Name it, count it, or describe it in a phrase a reader could check.
- If you can fill every overlap with something real, keep the Venn. It’s doing its job.
- If only the very middle has an answer, and that answer is your company name, the diagram is a logo with circles around it.
- If none of the overlaps has an answer, the circles are decoration, and a different shape will serve you better.
Most of the time, what you’re really showing falls into one of a handful of patterns. Each one has a better shape.
Fix 1: Three things you do? Put them in a row
The most common empty Venn shows three capabilities, services or pillars. They don’t overlap in any meaningful way; they sit side by side, and together they describe what the team does. That’s a row, not a set of circles.
A row of three columns gives each pillar the same weight, makes room for a line that says what it actually does, and reads left to right like a sentence. It also gives you somewhere to put proof: a number, a client type or an example under each heading.
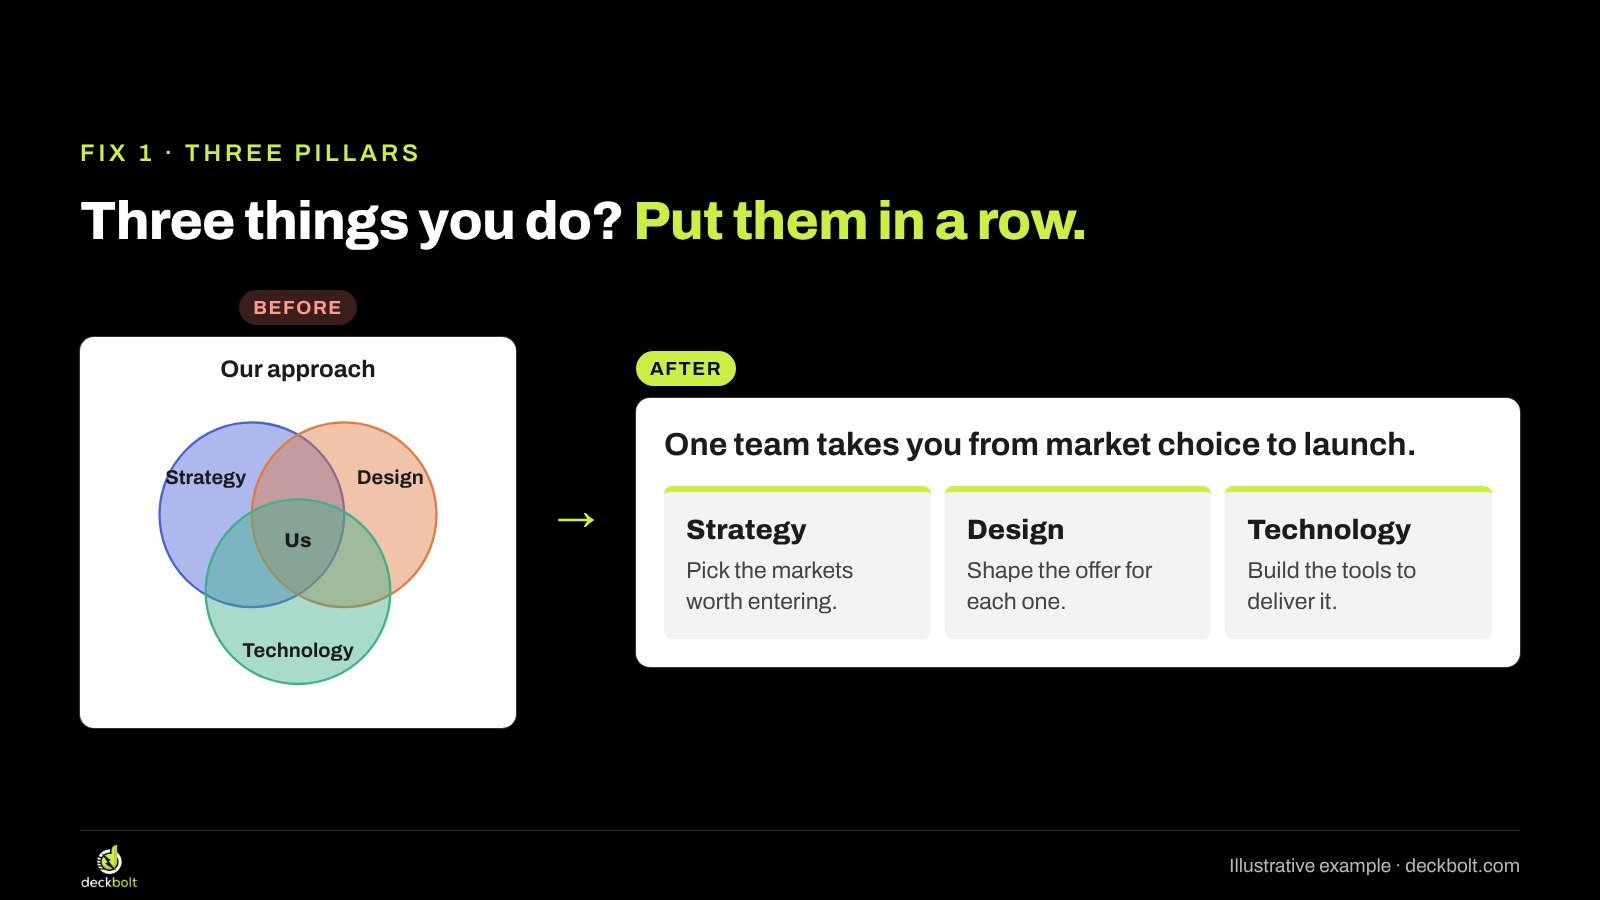
Write each column’s line as an action, not a label. “Strategy” tells the reader nothing new. “Pick the markets worth entering” tells them what this team will do for them. Then give the slide a title that ties the three together: “One team takes you from market choice to launch.” The reader gets the same idea the circles were hinting at, stated plainly.
To build it in PowerPoint, draw three rectangles of equal width, select them and use Shape Format → Align → Distribute Horizontally so the gaps match. In Google Slides, select the three shapes and use Arrange → Distribute → Horizontally. A thin accent bar at the top of each column is enough to make them read as a set.
Fix 2: Steps in an order? Draw a flow
Sometimes the three circles are really three stages: Research, Build, Launch. Circles have no first and no last, so a Venn hides the one thing that matters about steps, which is their order.
Draw them as a flow instead: boxes left to right with an arrow between each one, and the timing under each step. “Weeks 1–2, weeks 3–6, weeks 7–8” turns an abstract process into a plan a client can hold you to. If the steps genuinely overlap in time, show that with a simple timeline where the bars overlap, which is a real overlap a reader can see.
In PowerPoint, SmartArt has a Process category (Basic Process is a good start), or you can draw boxes and connect them with arrows from Insert → Shapes. In Google Slides, Insert → Diagram → Process gives you a ready-made flow you can edit.
Fix 3: Two groups that really overlap? Put the counts in it
Venn diagrams are at their best when the overlap is the finding. Say you want to show how many paying customers also read your newsletter. That’s two real groups with shared members, which is exactly what a Venn is for.
But a Venn with only labels still makes the reader guess. Put the counts in every region: 900 subscribers who aren’t customers, 300 people in both, 600 customers who don’t subscribe. Then write the meaning in the title: “Only 1 in 3 paying customers reads our newsletter.”
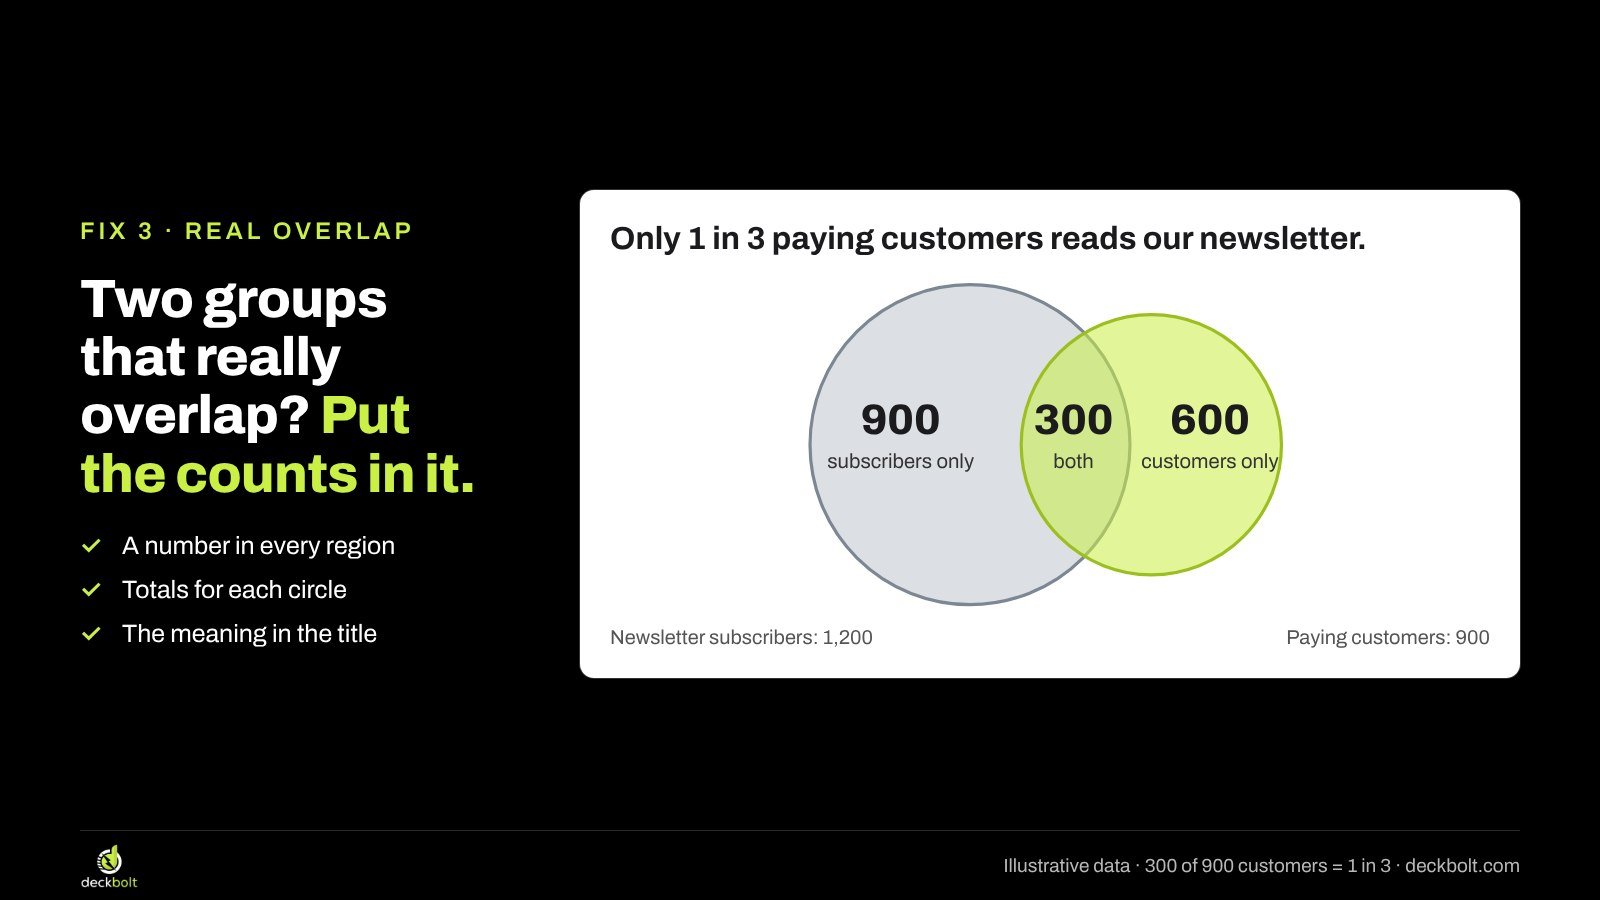
A few rules help these diagrams hold up:
- Put a number in every region, including the parts that don’t overlap.
- Give the totals for each circle somewhere on the slide, so readers can check the math.
- If you size the circles, size them by area, not width; a circle twice as wide holds four times the area. If you can’t size them properly, keep them equal and let the numbers do the work.
- Keep it to two or three circles. Beyond that, the overlaps multiply and a table is usually clearer.
In PowerPoint, draw two ovals, then use Format Shape → Fill → Transparency (around 40 to 50 percent) so the overlap shows through, and add text boxes for each count. In Google Slides, draw ovals with Insert → Shape, then set Fill color → Custom and lower the transparency slider.
Fix 4: A “sweet spot” claim? Make the qualities two axes
Another common Venn says “we’re where X meets Y”: easy to use and built for compliance, affordable and premium, fast and thorough. The overlap is meant to be your unique position.
The problem is that the diagram only shows you. It doesn’t show where anyone else sits, so the claim has nothing to be compared against. Two qualities you combine are really two dimensions, and two dimensions make a 2×2.
Put one quality on each axis and place yourself and the alternatives your audience is actually considering: named competitors, the spreadsheet they use today, doing nothing. Now the “sweet spot” is a quadrant, and the reader can see that it’s empty except for you. Only place competitors where you have evidence you could show if asked; a 2×2 drawn to flatter you will be challenged.
The title should still say the point in words: “The only option that’s quick to set up and covers compliance.” The chart is the proof, not the message.
A worked example: before and after
Here’s the full change on one illustrative slide. The before is titled “Our approach”, with the subtitle “Where strategy, design and technology meet” and three overlapping circles with “Us” in the middle. Nothing on the slide tells a client what happens when they hire this team.
The after keeps the same three ideas but drops the circles. The title states the promise: “One team takes you from market choice to launch.” Below it sit three equal columns. Strategy: pick the markets worth entering. Design: shape the offer for each one. Technology: build the tools to deliver it. If the team has proof, a short line under each column carries it.
Nothing new was invented. The content was always there; the circles were standing in for it. That’s the pattern with most empty Venns: the fix is writing down what you meant.
Common mistakes to avoid
- Using a Venn for things that are parts of a whole. If three products make up 100 percent of revenue, they don’t overlap; show them in a single bar or a short ranked list with numbers.
- Putting the logo in the middle as the punchline. It’s a claim, not evidence. Replace it with the specific thing you do that others don’t.
- Labelling overlaps with vague words like “Synergy”, “Innovation” or “Value”. If the label could sit in any company’s deck, it isn’t saying anything.
- Adding a fourth and fifth circle. Overlaps become impossible to read, and some combinations can’t be drawn cleanly with circles at all.
- Bright, fully opaque fills. The overlaps disappear under the top shape. Use transparency or outlines so every region is visible.
A quick checklist before you send it
- Can you name what sits in every overlap?
- Are the circles groups with members, not topics or departments?
- If there’s an order, did you use a flow instead?
- If there are numbers, are they on the diagram, in every region?
- Does the title say what the overlap means, in a full sentence?
If you can tick all five, your Venn diagram is earning its place. If not, one of the four alternatives above will almost always say more in the same space. For more on turning bullet points and decorative shapes into diagrams that carry meaning, see our guides on the diagram hiding in your bullet list, using arrows in slide diagrams and formats for a competition slide, where 2×2 matrices often show up. And if your slide is going to senior readers, put the answer first.
Note: the companies, teams and numbers in this article are illustrative examples, not real data.
Want a second pair of eyes on the diagrams in your next strategy, sales or pitch deck? Request a free deck review and we’ll show you which slides are working and which are decoration.