
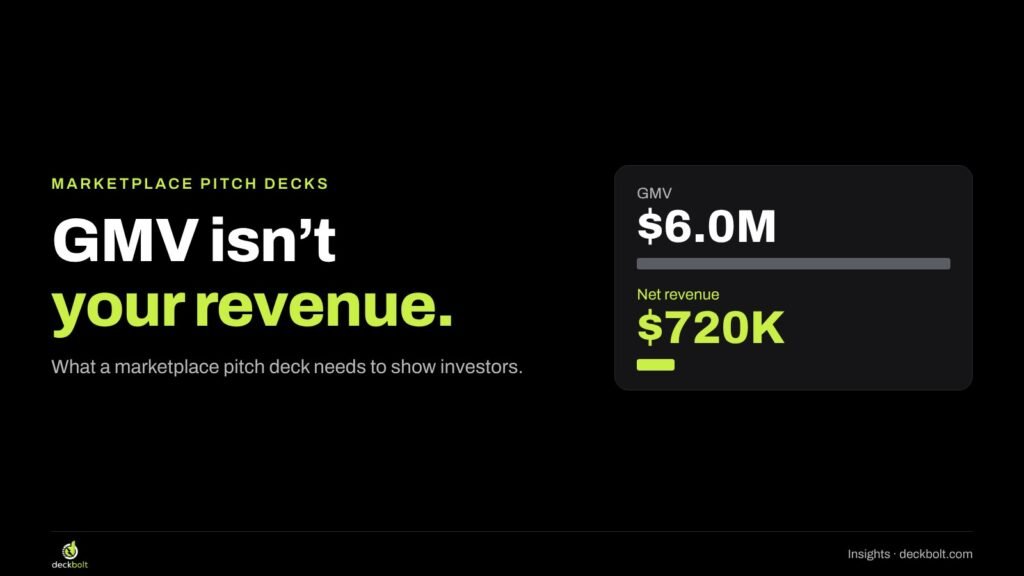
“$6M in sales through our platform.” It’s a common headline on a marketplace traction slide, and it’s a strong number. But on its own, it hides the figure investors usually look for first: how much of that $6M the company actually keeps.
Marketplaces are read differently from most startups. There are two sets of customers, money that passes through you but isn’t yours, and a business that only works once both sides show up in the same place at the same time. A deck that presents a marketplace like a simple software company leaves the most important questions unanswered.
This guide is for founders building two-sided marketplaces: platforms that connect buyers and sellers, clients and freelancers, renters and owners. We’ll walk through the questions investors tend to bring to these decks, five ways to answer them on your slides, a worked before/after example and a checklist to run before you send.
Why marketplace decks get misread
The core problem is vocabulary. In a marketplace, three numbers often get blurred together:
- GMV (gross merchandise value) is the total amount buyers spend through your platform.
- Net revenue is the part of that money you keep: your commissions and fees.
- Take rate is the share you keep, net revenue divided by GMV.
When a deck says “revenue” but shows GMV, or says “sales” without saying whose, the reader has to stop and work out which one they’re looking at. Once they find out a number was bigger than it should have been, every other number in the deck gets a second look. That’s the real cost: not one confusing slide, but lost trust in the rest.
The fix isn’t to hide GMV. It’s a useful measure of how much activity runs through you. The fix is to show it next to the number it produces.
The three questions investors bring
Most of what a marketplace deck needs to show comes back to three questions:
- How much do you keep? Your take rate and net revenue, not just the money that flows through.
- Do both sides show up? Enough buyers to keep sellers busy, enough sellers to give buyers choice.
- Do they come back? Repeat orders from buyers, and sellers who stay active month after month.
A GMV headline answers none of these. The five fixes below answer all three, and most of them fit on the slides you already have.
Fix 1: Put GMV and revenue side by side
Show both numbers together, with the take rate between them, as a simple equation: GMV × take rate = net revenue. In our illustrative example, a marketplace where cafés order baked goods from local bakeries, that’s $6.0M × 12% = $720K.
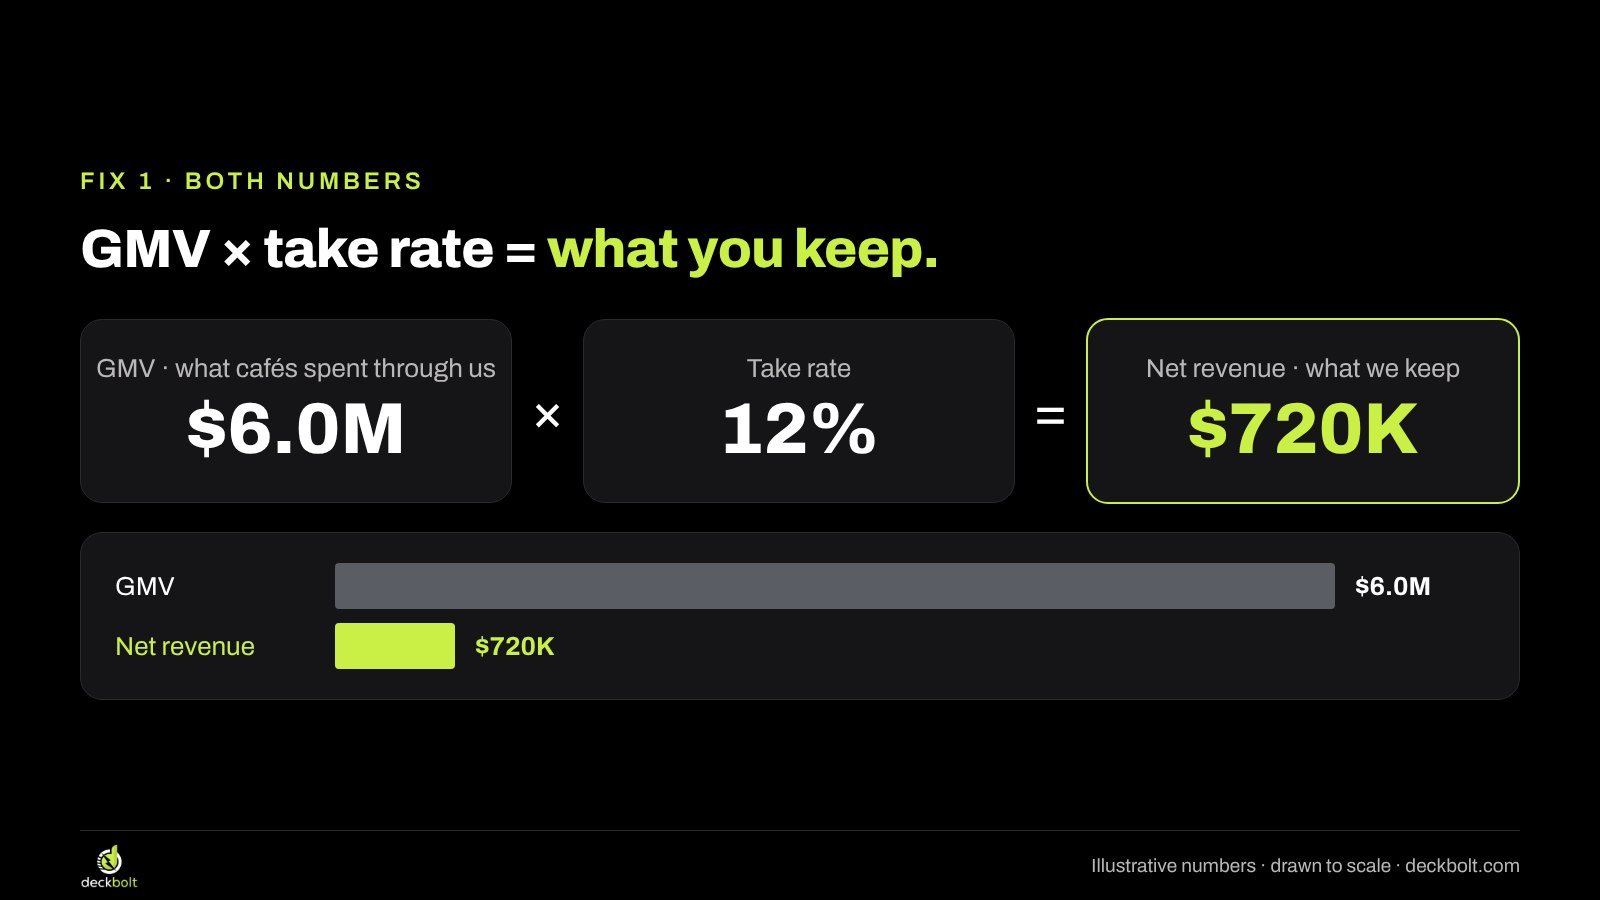
Drawn to scale, the gap is obvious: the revenue bar is about an eighth of the GMV bar. That’s not a weakness to hide; it’s how marketplaces work, and investors know it. What they want is to see that you know it too, and that you’re not hoping they’ll mistake one number for the other.
Label every number on every slide. If a chart shows GMV, the axis or title should say GMV. If your financials slide shows revenue, make sure it’s net revenue and that it matches the traction slide. Our number cross-check guide covers how to keep figures consistent across a deck.
Fix 2: Show what the take rate pays for, and who pays it
A take rate on its own invites a follow-up: why would anyone pay that? Answer it on the slide. Break down where a typical order’s money goes, and say what each side gets for its share.
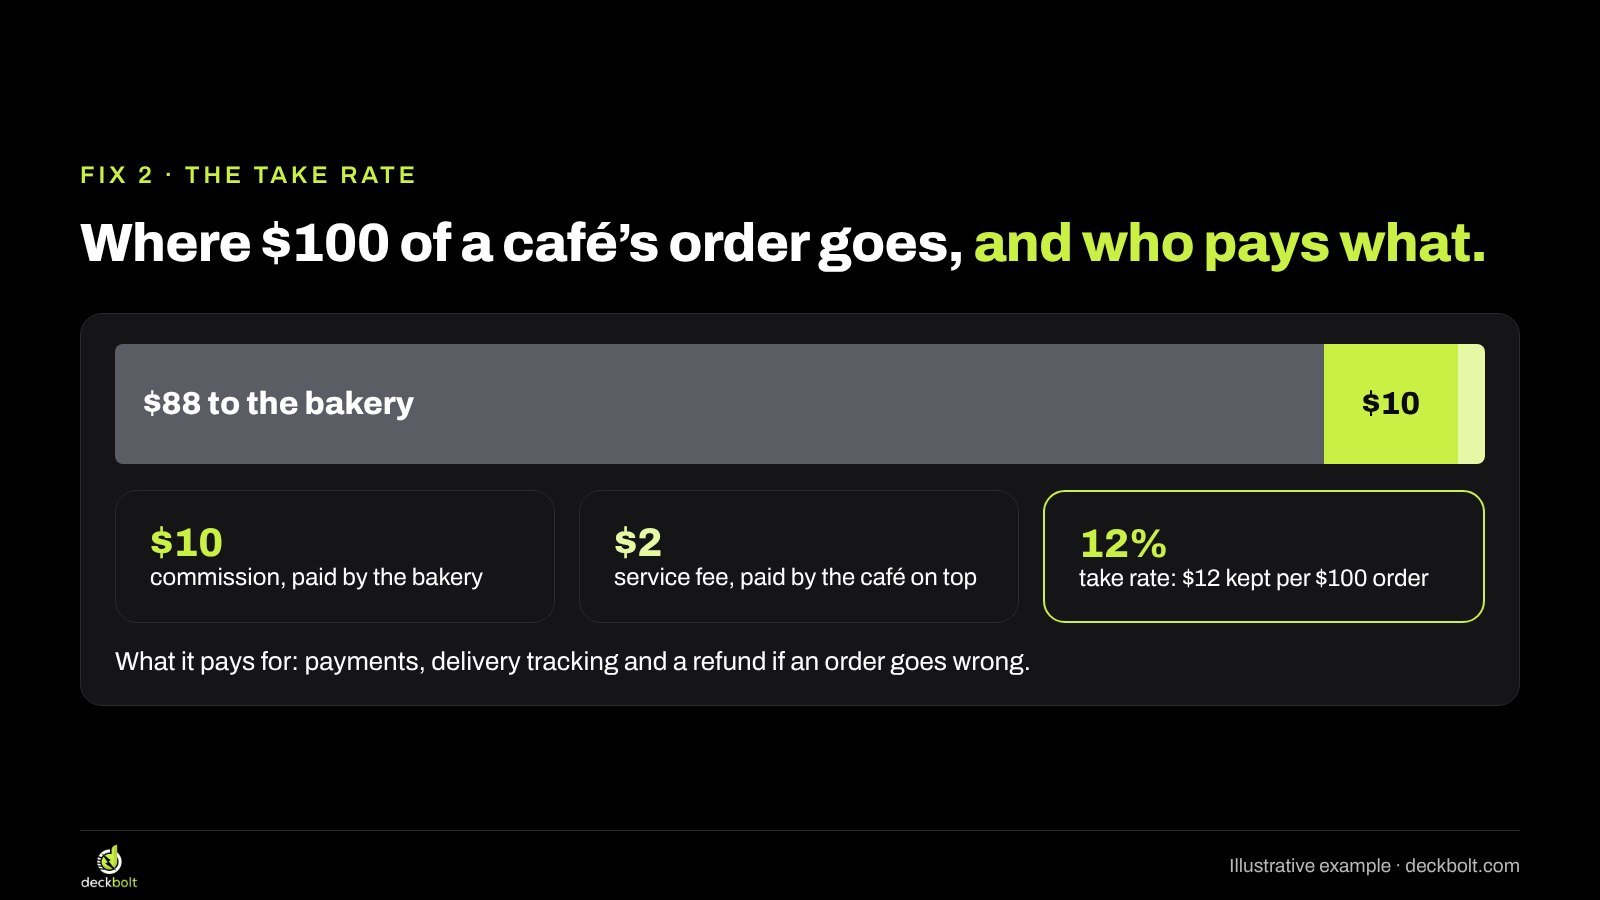
In the example, a café places a $100 order. The bakery receives $88 and pays a $10 commission. The café pays a $2 service fee on top. The platform keeps $12 of every $100 order: a 12% take rate. In return, both sides get payments handled, delivery tracking and a refund if an order goes wrong.
Two details make this slide stronger. First, show which side pays what, because it tells investors where your pricing power sits. Second, if your take rate is changing, say why. A take rate that rises because you added a service people pay for tells a different story from one that falls because you’re discounting to win share.
If you charge differently by segment, for example a lower commission for your largest sellers, show the blended take rate on the main slide and put the breakdown in the appendix, where anyone who wants the detail can find it.
Fix 3: Prove liquidity with one clear number
Liquidity is the marketplace word for “do things actually get matched?” A platform can have thousands of listings and thousands of visitors and still fail if buyers can’t find what they need when they need it.
Pick the one liquidity number that fits your market and track it over time. Common choices include:
- Match rate: the share of requests or orders that find a supplier.
- Time to match: how long it takes a request to be filled.
- Sell-through: the share of listings that sell within a set period.
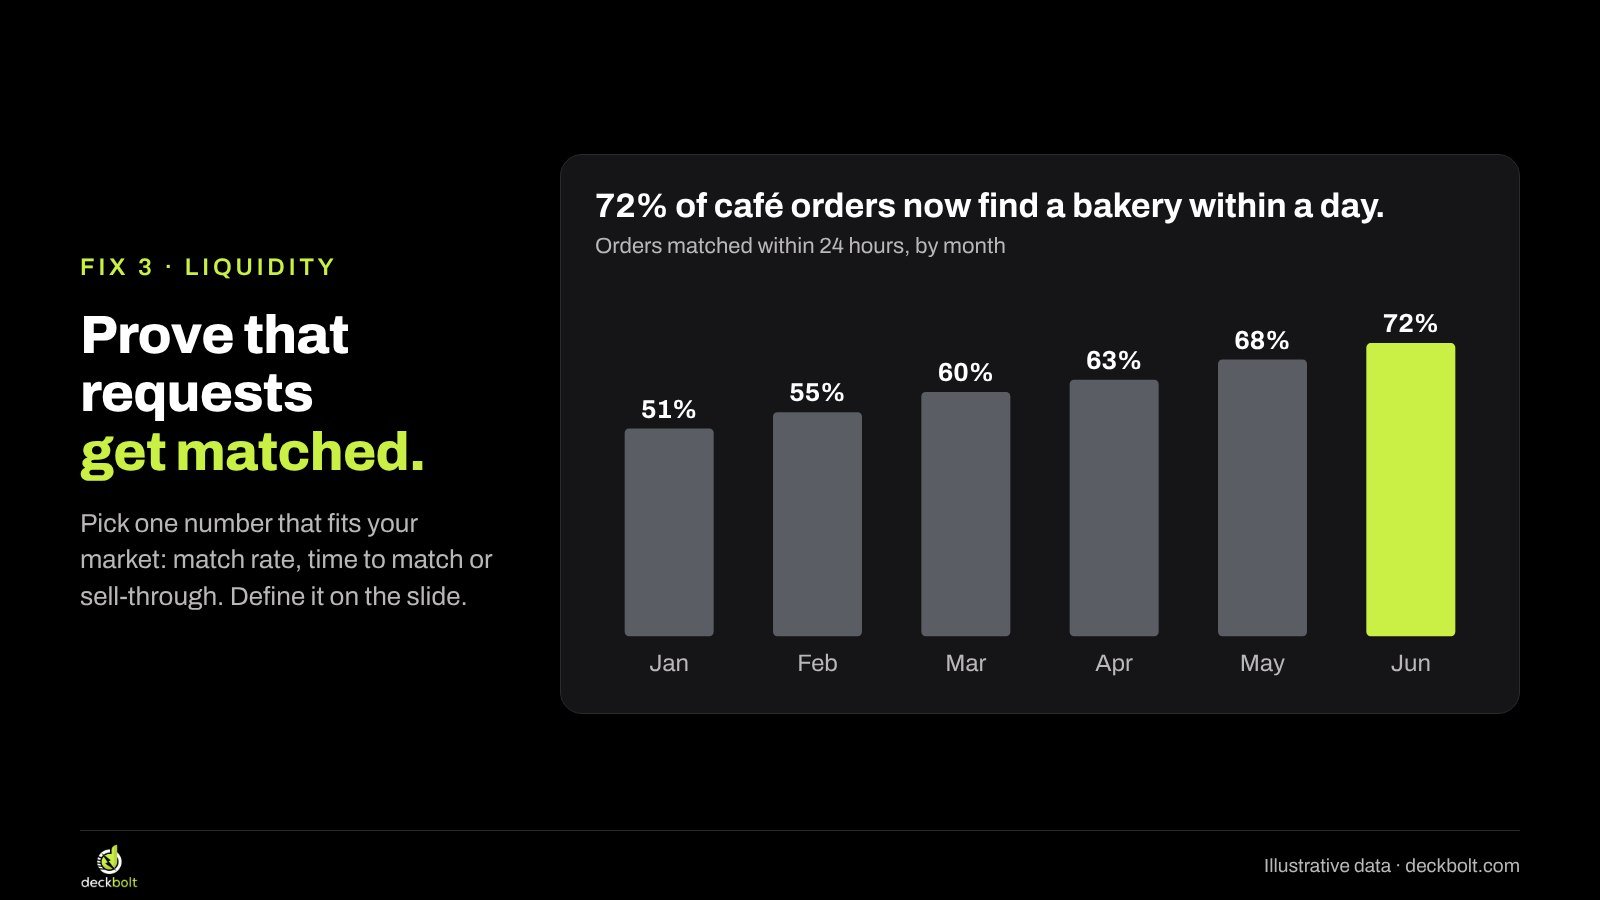
In the illustrative example, the share of café orders matched with a bakery within 24 hours rose from 51% in January to 72% in June. That’s a slide title in itself: “72% of café orders now find a bakery within a day.” It shows the market getting healthier as it grows, which is the pattern investors want to see.
Define the number on the slide. “Matched” can mean accepted, delivered or paid; write which one you mean, so the number holds up when someone asks.
Fix 4: Show both sides growing, and coming back
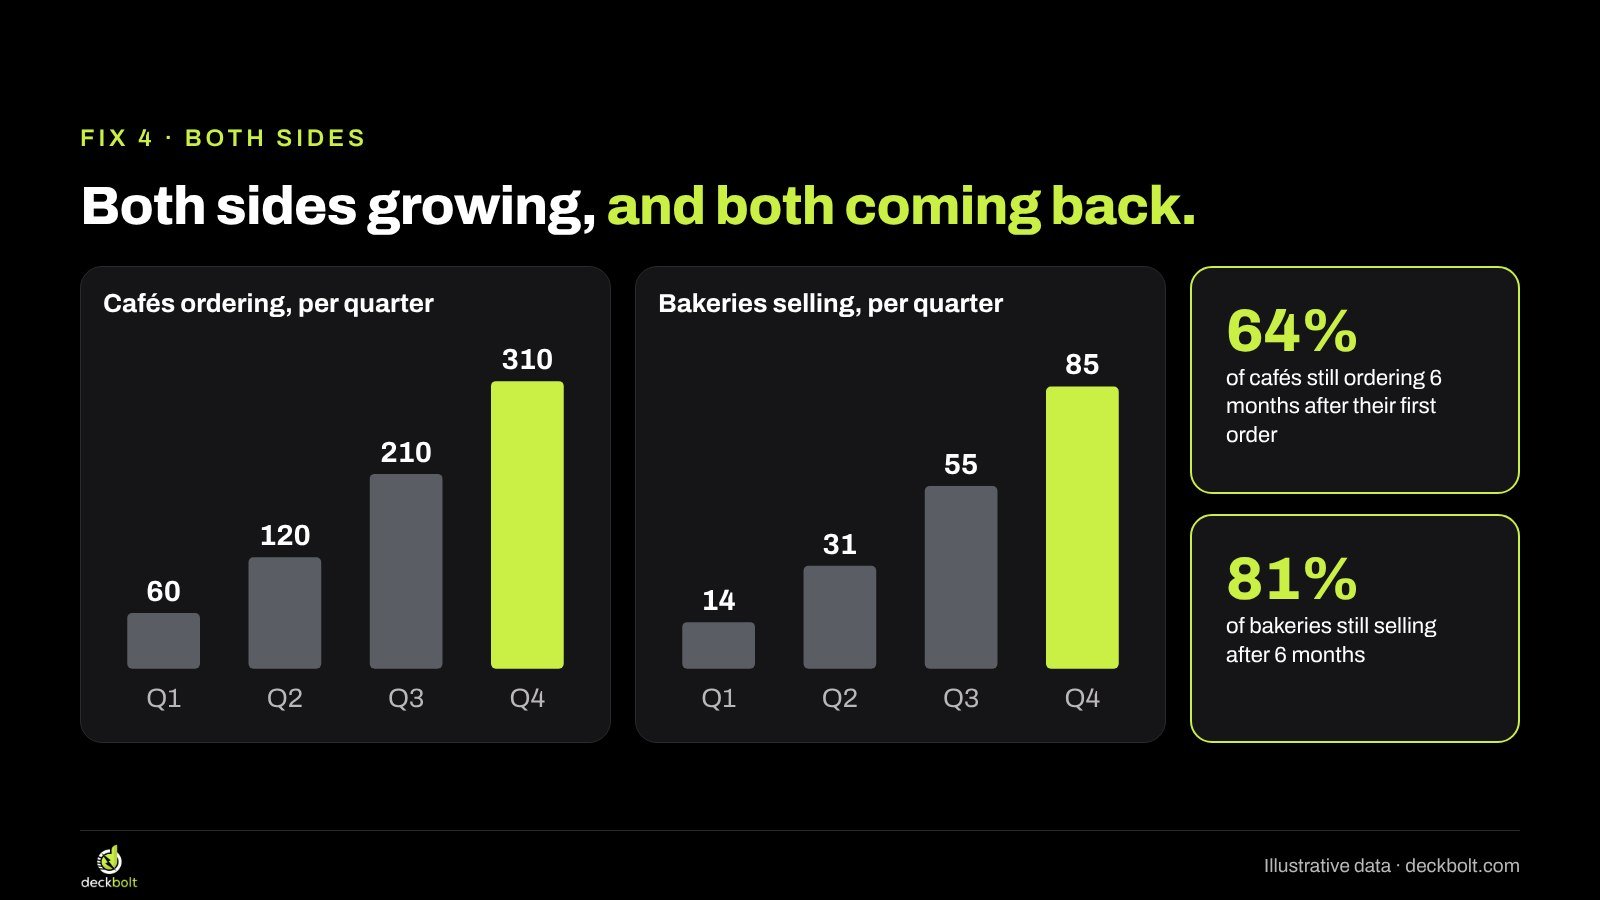
A marketplace has two growth curves, and both matter. Show buyers and sellers side by side, on the same time periods. In the example, cafés ordering per quarter went from 60 to 310 over the year, and active bakeries from 14 to 85. If one side is racing ahead of the other, that’s worth explaining: too many buyers and not enough supply means frustrated customers; the reverse means sellers who drift away.
Then show who comes back. For many marketplaces, repeat behaviour is the clearest sign the match actually worked. Count both sides: in the example, 64% of cafés are still ordering six months after their first order, and 81% of bakeries are still selling after six months.
If you have enough history, a cohort view is stronger than a single percentage: group buyers by the month they joined and show how many are still active over time. For a software-company view of similar numbers, see our guide to the metrics investors expect in a SaaS pitch deck.
Fix 5: Say how you won the first side
Every marketplace starts empty, with no buyers because there are no sellers and no sellers because there are no buyers. Investors know this problem well, and they want to see that you’ve solved it at least once, somewhere.
Tell that story in a few plain steps. In the example: pick one side (bakeries first, because they bring the products cafés want), win it by hand (14 bakeries signed in one city, one visit at a time), let it pull in the other side (cafés joined to order from those bakeries), then repeat city by city. Four lines on a slide show a method, not just a hope. If you’re still in your first city, say so plainly, and say what the second city will need that the first didn’t.
This is also where your go-to-market plan connects to your traction. If you’ve done it once, the obvious next question is how you’ll do it in the next market, and what it will cost.
A worked example: before and after
Here’s how the traction slide changes. The before has one big number, “$6.0M GMV”, with “Growing fast · 300+ cafés” underneath. It’s impressive and it’s true, but it leaves every important question open.
The after leads with a sentence: “Cafés spent $6.0M through us last year. We kept $720K.” Under it sit three supporting numbers: a 12% take rate, 72% of orders matched within a day, and 64% of cafés still ordering at month six. The slide now answers all three investor questions before anyone has to ask.
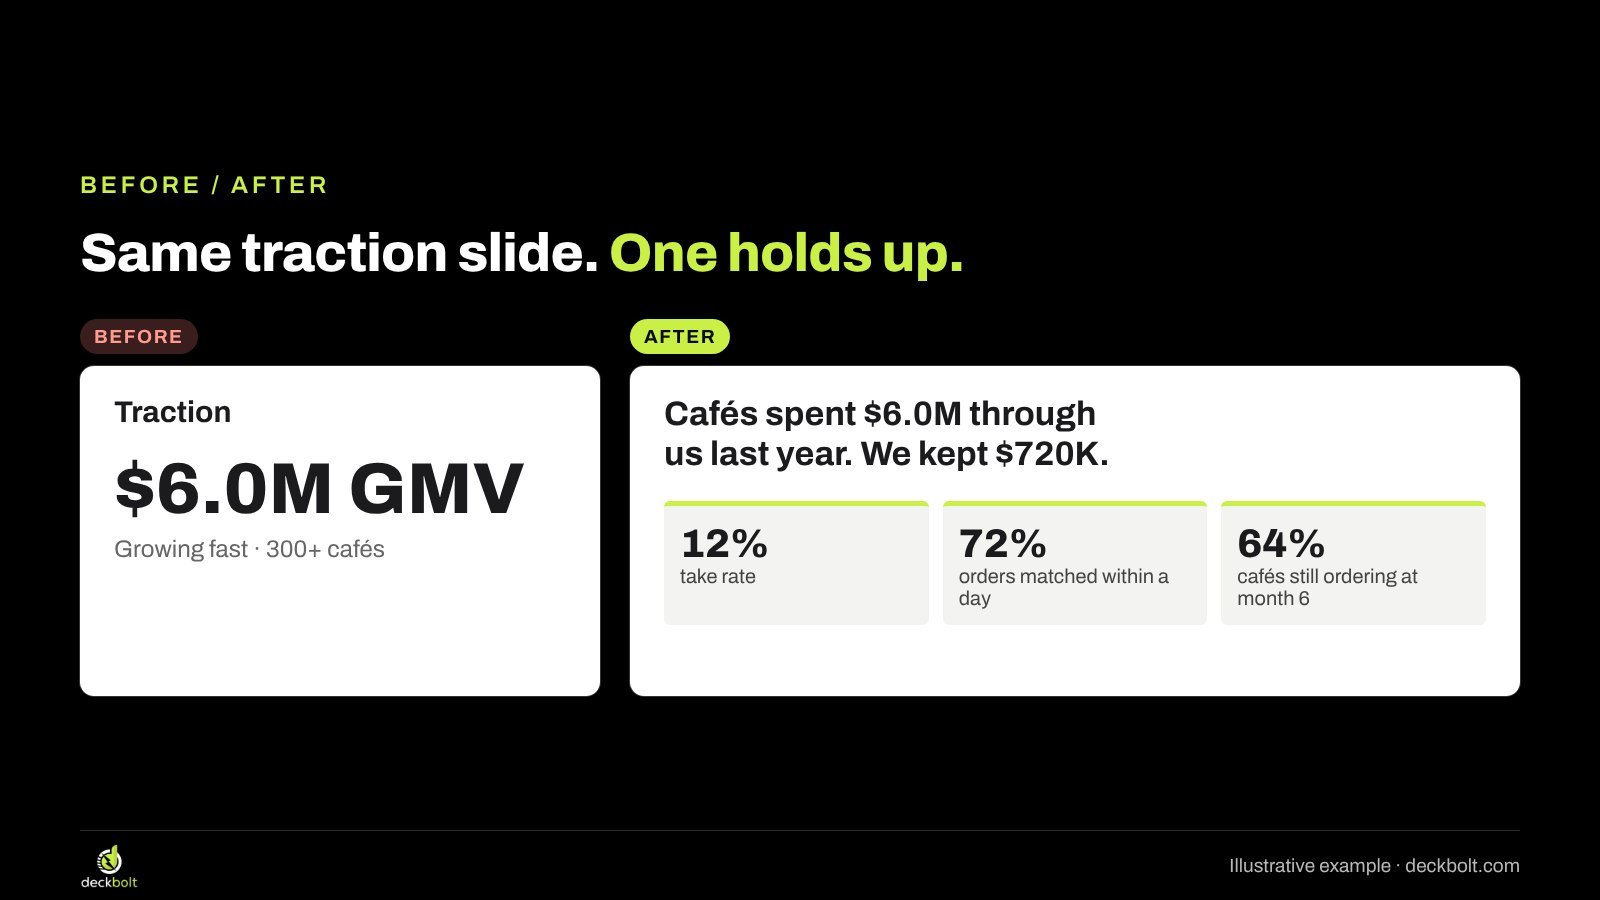
Notice that the after doesn’t hide the GMV. It still leads with the biggest number, but it immediately says what that number means for the business. That’s the balance to aim for.
Common mistakes in marketplace decks
- Calling GMV “revenue” anywhere in the deck, even once. If it happens on the traction slide and the financials disagree, the mismatch will be found.
- Showing only one side’s growth. Strong buyer numbers with flat supply are a warning, not a win.
- Quoting a liquidity number without defining it. “Matched”, “completed” and “fulfilled” can mean very different things.
- Projecting a higher take rate without a reason. If your model assumes you’ll keep more of each order later, say what will justify it.
- Leaving out how the first side was won. Without it, the growth curves look like luck.
A checklist before you send it
- Are GMV and net revenue both on the slide, clearly labelled?
- Can a reader see your take rate, what it pays for and who pays it?
- Is there one defined number for liquidity, shown over time?
- Do both sides grow, and do both come back?
- Do you say how you won the first side?
One last test: could an investor work out your revenue from the traction slide alone? If not, put the take rate on it. For more on what belongs on these slides, see our guides to the pitch deck traction slide and the financials slide.
Note: the marketplace, numbers and percentages in this article are illustrative examples, not real data or benchmarks.
Raising for a marketplace and want the numbers to hold up to a second look? Request a free deck review and we’ll show you where your slides raise questions, and how to answer them on the page.