
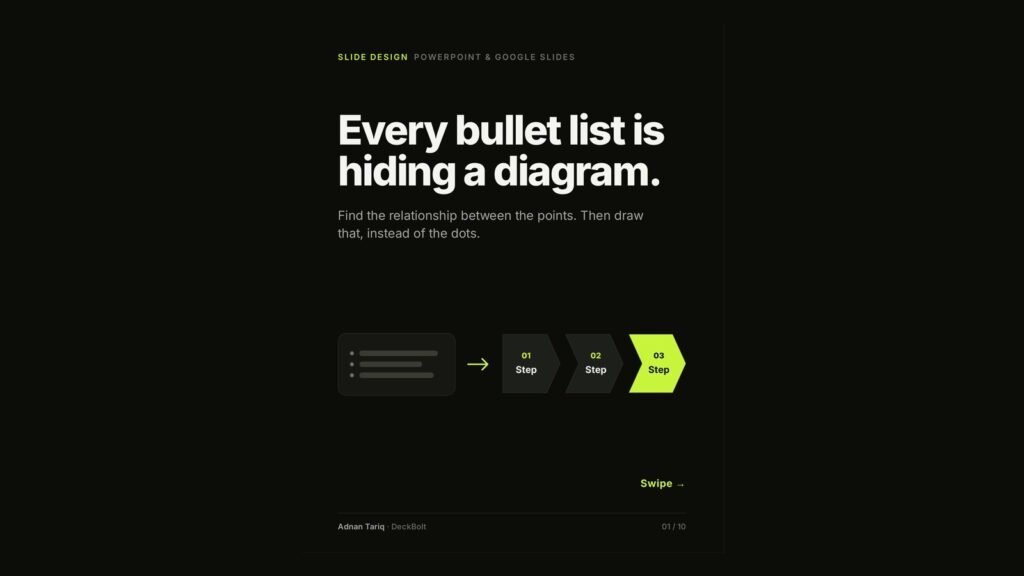
Bullets make every idea look equal: same indent, same size, same dot. But the ideas on a slide usually relate to each other. One leads to the next, two compete, one sits above the others. A bullet list hides that relationship. A diagram shows it.
The trick is to ask one question: how do these points connect? The answer is usually one of five relationships, and the words in your bullets will tell you which.
1. Steps → a process flow
Signal words: first, then, next, finally.
“First, sign up. Then connect your data. Finally, get your first report.” becomes three chevrons in a row: 01 Sign up, 02 Connect your data, 03 Get your first report, with the last step highlighted.
2. Options → a comparison
Signal words: vs, instead of, but, compared to.
“Old way: manual, weekly, error-prone. New way: automatic, daily, checked.” becomes a two-column table with rows for effort, frequency and accuracy, and the new way highlighted.
3. Levels → a hierarchy
Signal words: includes, made up of, under, because.
“Goal: grow repeat customers” with three indented sub-points becomes a simple tree: the goal at the top, with better onboarding, a loyalty offer and faster support beneath it.
4. Loops → a cycle
Signal words: repeat, again, feeds back, each time.
“Plan the campaign, launch it, measure the results, improve, then plan again” becomes a circle: plan → launch → measure → improve → repeat.
5. Dates → a timeline
Signal words: Q1, Q2, by March, phase 1, in 2027.
“Q1: pilot with 3 teams. Q2: roll out company-wide. Q3: add integrations.” becomes a horizontal timeline with each milestone on its own point.
Five bullets, one picture
In an illustrative example, a slide titled “Our onboarding process” lists five long bullets about signing the agreement, connecting data, configuring dashboards, the first weekly report and ongoing check-ins. Rebuilt, it becomes “Customers go live in 4 steps”: four chevrons (sign and log in, connect data, we set up dashboards, first report) and one line underneath for ongoing check-ins with an account manager. Same information, understood in seconds.
Save this for your next deck
| If the bullets say… | Draw a… |
|---|---|
| first, then, next | Process flow |
| vs, instead of, but | Comparison |
| includes, made up of | Hierarchy |
| repeat, again, feeds back | Cycle |
| dates, quarters, phases | Timeline |
No relationship at all? Keep the list, cut it to three points, and let the title carry the message. For more on text-heavy slides, see Why Your Slides Have Too Much Text.
Got a deck full of bullet slides? Send it over for a free deck review. We will point out which slides should become diagrams, and what each one should show.